Tiger, brandy, oyster saloon: A new way to read the Brisbane Courier

It’s reboot time! It’s been eighteen months since I last posted here, and four years since I started my PhD. But my thesis now is nearly out of the way, which means I can return to more recreational forms of writing. It also means I can unveil what I have been working on to keep myself sane during the final stages of my PhD. In case I never fully explained, my PhD was about the application of a computational text analysis technique called topic modelling within social science. Basically, I spent the last four years learning how to do useful things with large amounts of textual data — a practice known as text mining or text analytics. Along the way, I also spent time experimenting with ways of putting textual data on a map. You can see some of the early results in my other blog, which for the last couple of years has been just as neglected as this one.

The methods I explored in my thesis were all based on a dataset of news articles and other texts about coal seam gas development, which has been a touchy topic in recent years in Australia. But I never forgot about my local history blog, and I always hoped to return to it armed with a new bag of tricks. And now here I am, with bag in hand.

Cultural cartography

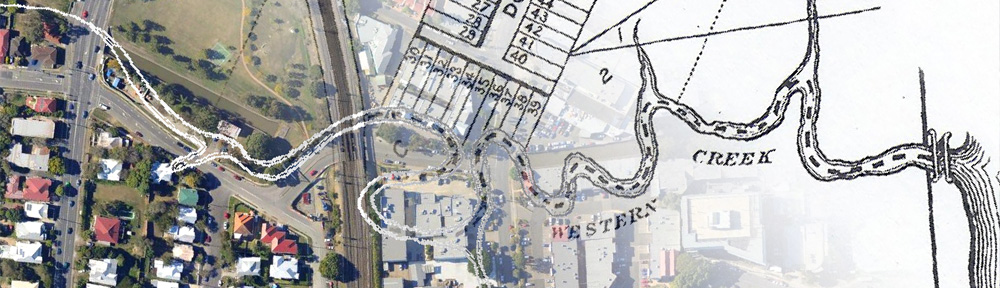
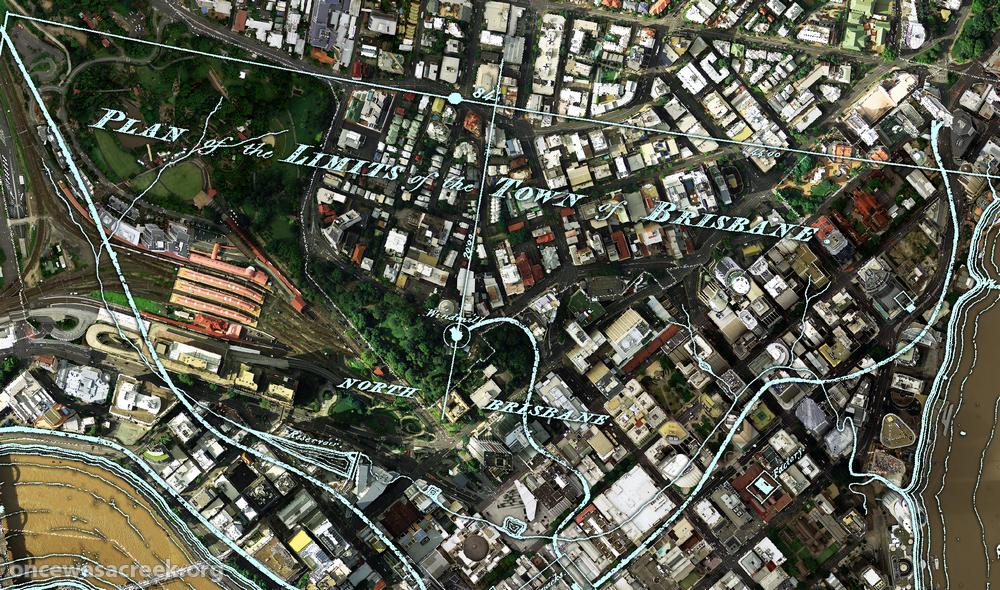
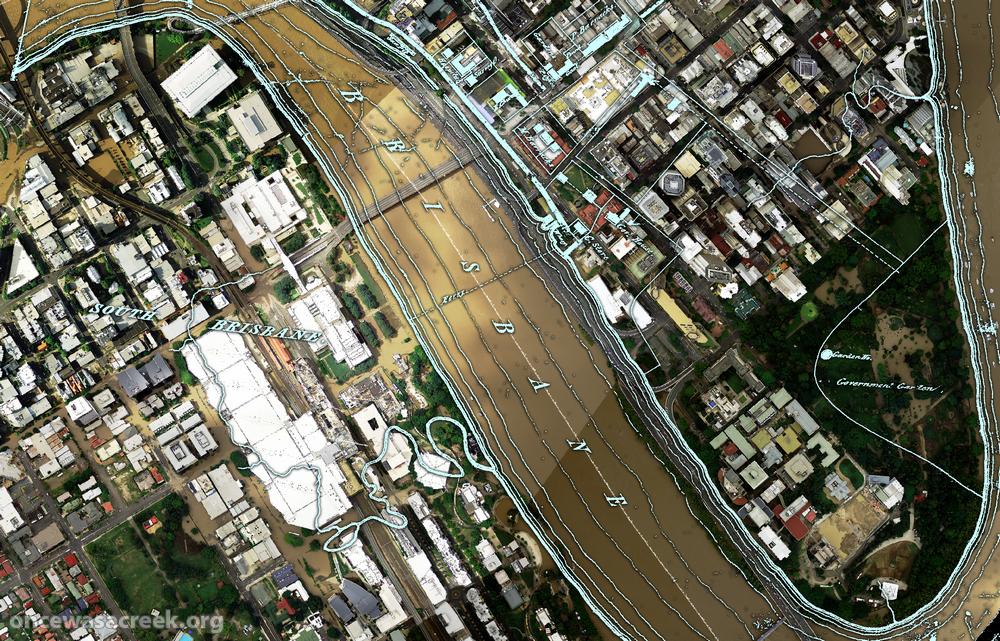
If you’ve spent any time exploring this site, you’ll know that I’m fond of projecting old maps and plans onto the modern landscape as a way of seeing how things have changed. I’ve done this by photoshopping the maps to extract the details and then loading the results into Google Earth, where they can be explored immersively and in three dimensions.

Langsville Creek as depicted in 1859, overlaid on the present-day landscape.

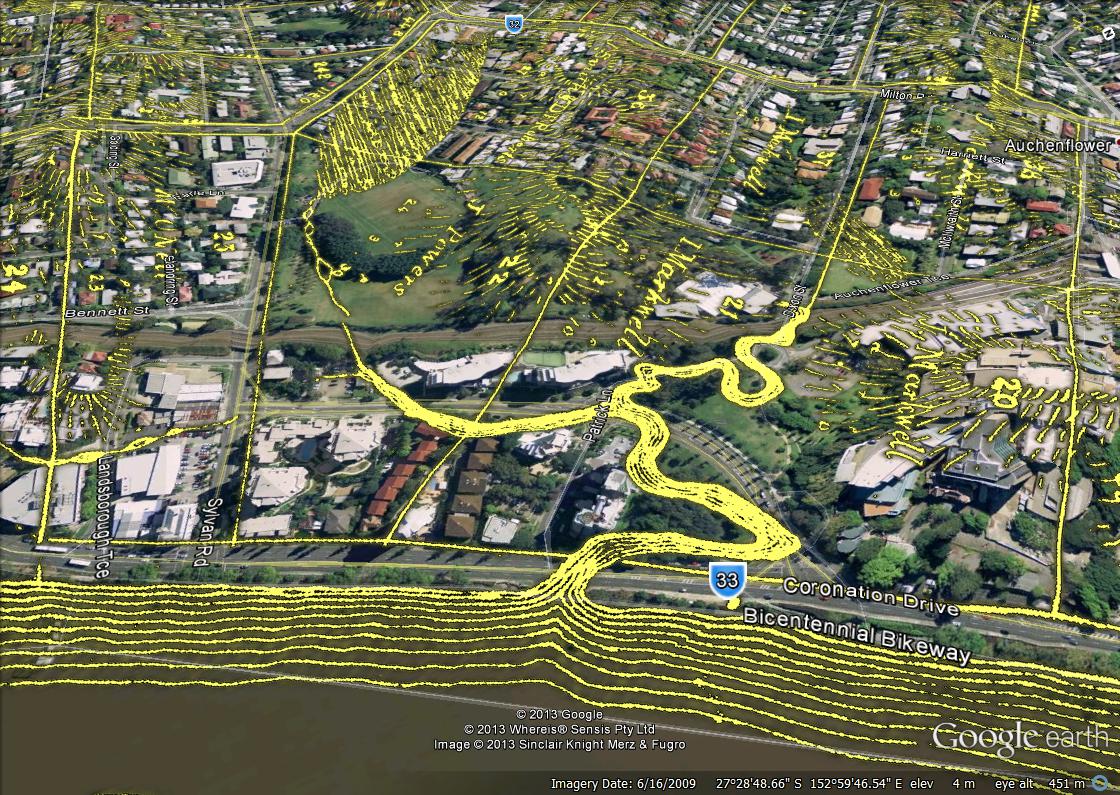
Figure 1. Langsville Creek as depicted in 1859, overlaid on the present-day landscape.

Continue reading

Fun with Google Earth

A few weeks back, I posted some images that I put together by combining old maps with recent aerial photographs. Since then, I’ve discovered how to import those same maps into Google Earth. This is really exciting, because it allows you to explore these maps in an interactive way. Instead of being stuck with an orthogonal ‘straight down’ view, you can move around and view things from any angle you choose. A gallery of examples is below. In these images are three different historical maps:

  • ‘Plan of the limits of the town of Brisbane’ (1843). You can see the original in the Queensland Historical Atlas.
  • ‘Plan of Portions 203 to 257 in the Environs of Brisbane, Parish of Enoggera, County of Stanley, New South Wales’ (1859). This is available at the Queensland State Archives (Item ID620656) and the State Library (Record 727379).
  • ‘Plan of Brisbane Water Works’ (1864). This map shows the pipeline route between Enoggera Reservoir and Brisbane City, and is available from the Brisbane City Council Archives.

Boundary Creek as depicted in 1864. In the foreground is the Coronation Drive Office Park, and behind it is Suncorp Stadium.

Boundary Creek as depicted on in 1864. In the foreground is the Coronation Drive Office Park, and behind it is Suncorp Stadium.


Continue reading

Fun with maps

Western Creek as depicted on a map from 1859 (Queensland State Archives Item ID620656) overlaid on an aerial photograph of the January 2011 flood (Department of Natural Resouces & Mines)

Western Creek as depicted on a map from 1859 overlaid on an aerial photograph of the January 2011 flood

The banner at the top of this page features a depiction of Western Creek from A.R. McKellar’s 1895 map of Brisbane overlaid onto the modern suburban landscape. For me this captured the essence of what the site is about: gaining a deeper understanding the modern landscape though an exploration of its past. This graphic served its purpose, but I always knew that it was just a prototype for what could be achieved on a grander scale.

Now that I’ve collected a few more old maps, and discovered the free aerial photos taken during the 2011 flood (available from the Queensland Government Information Service), I have started to put the two together, and you can see the results on this hastily assembled new page: The lost creeks rise again. That page looks at how the floodzones from January 2011 in Milton and Auchenflower coincided with the location of old creeks, swamps and lagoons that have long been drained and buried. The image to the right (click to enlarge), which shows Western Creek between the river and Gregory Park, is one example.

What you won’t find on that page is the image below, which shows the CBD area overlaid with a plan of Brisbane from 1843. There wasn’t much to Brisbane at that stage (it had only just ceased being a penal colony), but in addition to the few buildings and roads marked, there are some fascinating natural features on this map. For example, notice the creek that begins up in Spring Hill and flows down towards a small dam which is right on top of where the new law courts are today. This was Brisbane’s first water supply. The stream continues through a small pool at King George Square and flows to the river near Creek Street. Click here to see this part of the map in a bit more detail.

A plan of the town limits from 1843 overlaiad on an aerial photo from January 2011.

A plan of the town limits from 1843 overlaid on an aerial photo (Dept of Natural Resources and Mines) from January 2011.

Across the river, nothing is marked in South Brisbane except for a creek that winds through the Convention Centre and Southbank Parklands (where there are now artificial streams). This enlargement shows the area in more detail.

I plan to use images like this wherever I can in future pages on this site, so stay tuned for more in the near future. What I’d really love to see is this done for as many old maps as possible, and the results made publicly available as files that can be imported into GIS software, or even via platforms like Google Maps or NearMap. Combined with historical aerial photographs as well, it would be an absolute treasure trove for professional and armchair researchers alike. So, anyone got some funds?