The catchments of the Crescent Reach

This post was updated on 24 May 2013 to include a revised outline of Langsville Creek catchment.

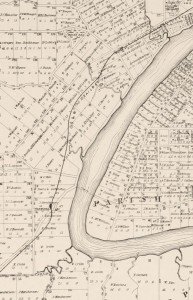
The Milton/Toowong Reach of the Brisbane River, depicted on a map from 1884.

The Milton/Toowong Reach of the Brisbane River, depicted on a map published in 1884

One of the first things I did when I created this website was to map out the catchment of Western Creek. While Western Creek has remained my focus, I have increasingly spent time thinking and writing about its neighbouring catchments as well, especially its three ‘sister’ catchments along what John Oxley called the Crescent Reach: Boundary Creek, Langsville Creek and Toowong Creek. These creeks are visible in several old maps, such as the one shown to the right, which dates from 1884.1

I figured that it was about time to put these other catchments onto a map. So, I fired up ArcMap, fed it some digital elevation data and eventually coaxed out of it the catchment boundaries. And of course, I then loaded them into Google Earth. The image below shows, from left to right, the catchments of Toowong Creek, Langsville Creek, Western Creek and Boundary Creek. (I haven’t mapped out the streams of the other catchments — that can wait for another day.)
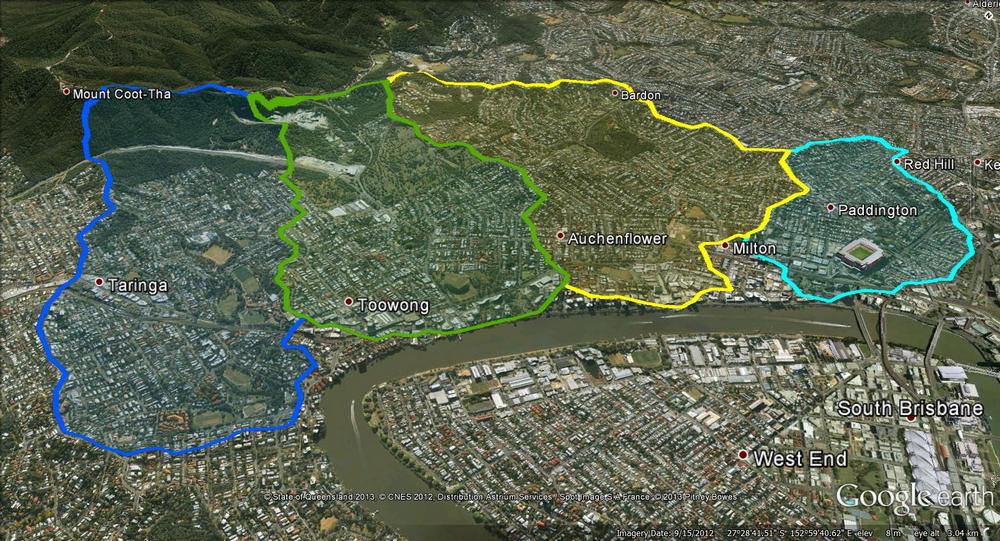
The catchments of the Crescent Reach. From left to right: Toowong Creek, Langsville Creek, Western Creek and Boundary Creek.

The catchments of the Crescent Reach. From left to right: Toowong Creek, Langsville Creek, Western Creek and Boundary Creek.

The precision of these boundaries is limited by the data used to create them, and you can tell by their jagged shapes that they are only approximations. Defining these boundaries can get particularly tricky as you get closer to the river, where the terrain is relatively flat.

But these boundaries don’t have to be perfect in order to be useful. The most interesting thing that they convey is the overall shape and size of the four catchments. At a glance, we can see that Boundary Creek is the smallest, while Toowong Creek and Western Creek are the largest. Using my GIS software, I calculated the catchment areas as follows:

Western Creek: 4.1 km2
Toowong Creek: 3.9 km2
Langsville Creek: 3.3 km2
Boundary Creek: 1.5 km2

I was surprised to discover that the Toowong Creek and Western Creek catchments are about the same size. I had always assumed that Toowong Creek was larger, and that this might be one reason why it (mostly) survived while Western Creek was (mostly) obliterated. But since their catchments are about the same size, their streams (at least in the lower reaches) should also have been comparable. Does this mean that we can use Toowong Creek as a reference point to tell us what Western Creek might have been like? Maybe, maybe not, as I suspect you would have to account for any notable differences in the geology, vegetation, topography and overall shape of the two catchments first. It is an interesting prospect, though.

Over the hill and far away

All four of these catchments share their uppermost boundaries with another catchment: that of Ithaca Creek. Ithaca Creek begins in the slopes of Mount Coot-tha and flows through Bardon, Ashgrove and Red Hill, where it meets its ‘parent’ stream, Enoggera Creek. The catchments of Ithaca Creek and Enoggera Creek are both shown in the image below, along with the four catchments of the Crescent Reach.
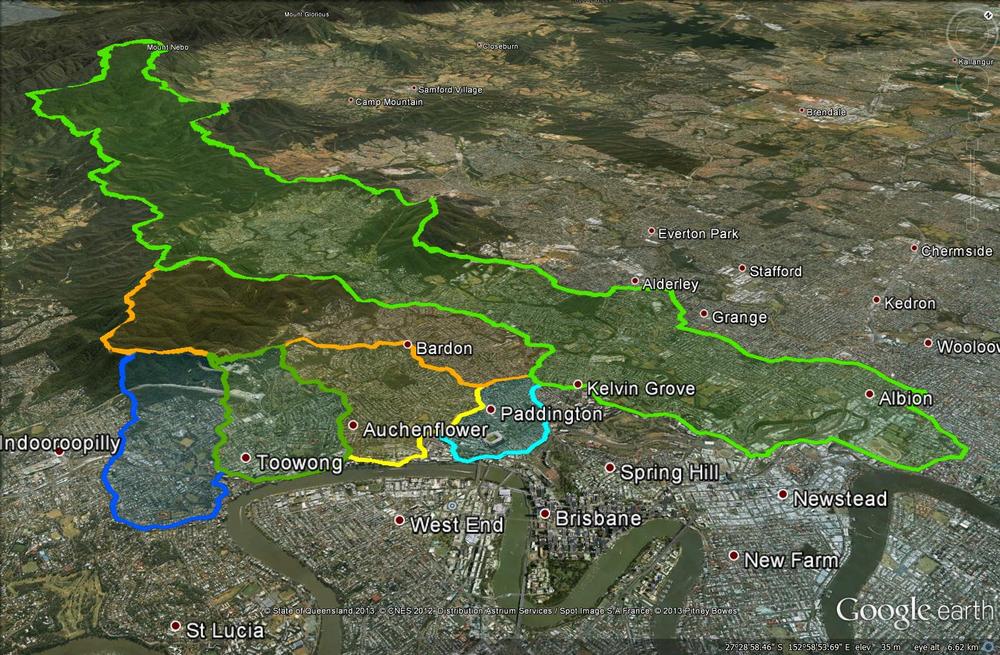
The four catchments of the Crescent Reach along with the larger catchments of Ithaca Creek and Enoggera Creek.

The four catchments of the Crescent Reach along with the larger catchments of Ithaca Creek and Enoggera Creek.

Ithaca Creek’s catchment covers an area of 11 km2 — almost as much as the four Crescent Reach catchments combined. But it too is dwarfed by the catchment of Enoggera Creek, which covers about 76 km2 (including Ithaca Creek, which is one of its tributaries) and extends all the way up through The Gap and into the D’Aguilar Range. No wonder Enoggera Creek was chosen to provide Brisbane’s first large-scale water supply.

And the rest of Brisbane? It could be mapped like this, too. In fact, I’d be surprised if the council hasn’t done it already, since these same catchments would delineate the networks of sewers and stormwater drains that the council maintains. And of course, where notable creeks still exist, their catchments will have been mapped to support monitoring and management initiatives such as Healthy Waterways. I hope that at some stage, this information will be made available for people to explore through Google Earth or similar platforms.

For now, you’ll have to make do with the six catchments I’ve discussed above. If you have installed Google Earth, then you can explore them yourself by opening (or downloading then opening) this file.

Notes:

  1. This map was produced by the Surveyor General’s Office in 1884. It is called ‘Moreton 20 chains to an inch, Sheet 1B’. It is held by the National Library of Australia, and is avaialble via Trove.

Time and tides

In John Oxley and the chain of ponds, I questioned whether Oxley could have found freshwater ponds downstream from Gregory Park, given that this part of the Western Creek is subject to regular inundation by the brackish tidal waters of the river. The tidal limit of the creek (or at least the drain) is no longer visible, being hidden somewhere underneath Frew Park, Gregory Park, or even further upstream. An article from The Brisbane Courier in 1896 reveals that tidal waters were entering Red Jacket Swamp, where they “killed the vegetation, and so caused it to fester and give off unhealthy odours”.1 Correspondence between Council engineers in the 1930s shows that at that time the tide even reached underneath Baroona Road.

But what about in 1824, when Oxley visited? Could it have been much different then? Since Oxley’s time, the river bed has been extensively dredged, and the bar at the river mouth cut away. Some of the narrower channels have been widened, and most of the riverbank (except in the upper reaches) has been cleared. Changes such as these, particularly the dredging and cutting of the bar, can be expected to affect the tidal dynamics of the river. The question is, how, and how much? Might the tidal limit of Western Creek have been very different in 1824 to what it is now, or even what it was in 1896 (given that dredging began in the 1860s2)?

The Wikipedia page for the Brisbane River, citing the 2001 State of South-east Queensland Waterways Report,3 states that “Historically, the Brisbane River contained upstream bars and shallows and had a natural tidal limit of only 16 km. The current tidal limit now extends 85 km upstream due to continual channel dredging”. If this is true, then the tidal dynamics of the river have changed dramatically indeed.

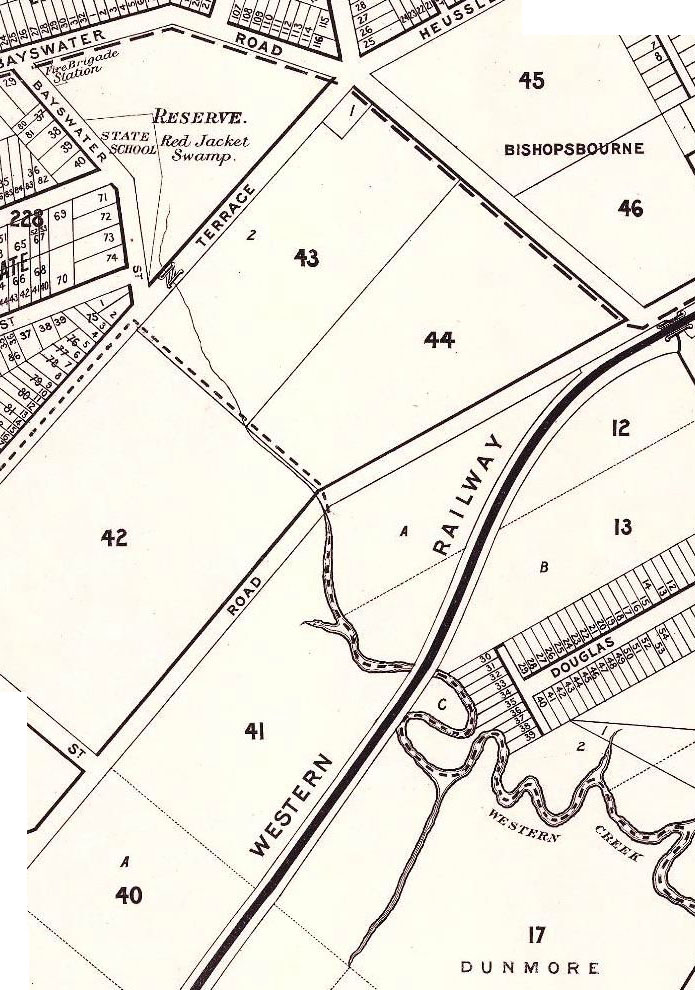
I’d really love to hear from someone with some insights, or even just some leads, regarding how these changes might have affected the tidal limit of Western Creek. Three things do make me wonder if whether it was indeed lower than Gregory Park. First, there is the way this part the creek is typically drawn on the old maps. The section from McKellar’s 1895 map shown below is a good example. Through the flats of Milton the creek is wide and winding, much like the river itself. Then after it crosses Milton Road, it thins and straightens as it enters Red Jacket Swamp. Second, there is the quote above from The Brisbane Courier, describing how the tidal water killed the vegetation in Red Jacket Swamp. If the swamp was naturally (i.e. historically) tidal, wouldn’t the vegetation in it be adapted to the salty water? And third, Red Jacket Swamp (Gregory Park) is marked on some of the early maps as ‘Water Reserve’. I’m not sure if this means it was seen as a potential water supply, or merely that it was a waterlogged chunk of government-owned land. If it was the former, then surely this land can’t have been much affected by the tides. Can somebody help??

A section of McKellar's 1895 map of Brisbane (retrieved from the Queensland Historical Atlas)

A section of McKellar's 1895 map of Brisbane (retrieved from the Queensland Historical Atlas)

The tides of Toowong

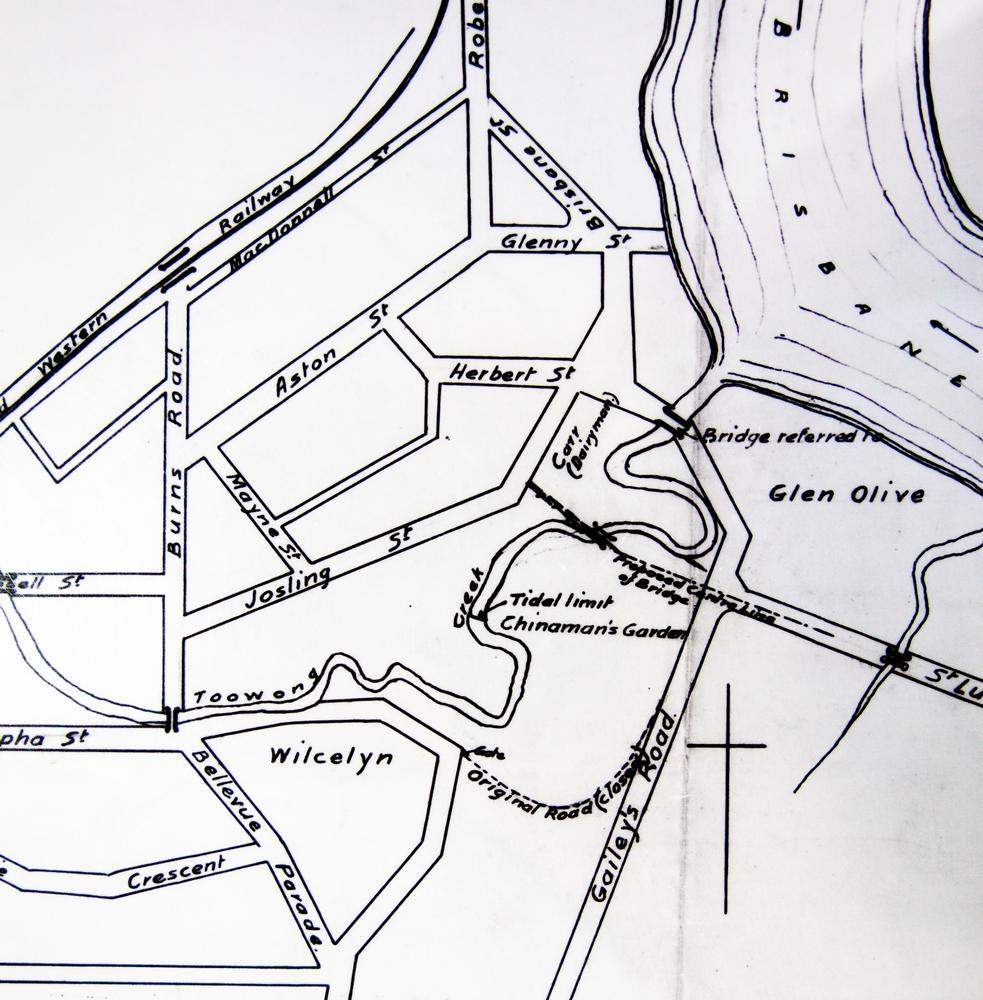
Just over a week ago I took a trip to Toowong Creek, where at Perrin Park you can see a “natural” mangrove-lined channel (though it is clearly not the original channel) giving way to a freshwater stream. The tide was low at the time, but I inferred (okay, guessed) its reach from the character of the vegetation and the quality of the water. Then quite fortuitously, while at the State Archives just the other day, I found a map made by the Queensland Survey Office in 1901 titled “Sketch plan showing position of bridge over Toowong Creek”,4 a portion of which is shown below.

Part of a sketch from 1901 indicating the tidal limit of Toowong Creek (Queensland State Archives Item ID620230)

Part of a sketch from 1901 indicating the tidal limit of Toowong Creek (Queensland State Archives Item ID620230)

Near the centre of the picture is the label “Tidal limit”, pointing to a line drawn across the creek. How does it compare to where it is today? By my reckoning, the limit today is somewhere near the hairpin bend just after the word “Toowong” on the map above. (I will report back once I have actually visited at high tide!) This is about 200 metres further upstream (as the crow flies) than the limit marked on the 1901 sketch.

What does this mean? I’m not sure, since we are not even comparing the same channel. As well as being straighter, the channel through the park today could well be deeper than the old one, which would result in the tide coming further upstream. Without knowing these sorts of specifics, it is hard to draw anything conclusive from this observation. Interesting though, isn’t it?

Notes:

  1. The Brisbane Courier, 24 July 1896, p7.
  2. G.R.C. Mcleod, “A short history of the dredging of the Brisbane River, 1860 to 1910”. This document is available online, and appears to be a chapter of a book, but unfortunately I cannot tell which book this is.
  3. Ivan Holland, Paul Maxwell and Angela Grice, ‘Tidal Brisbane River’, Chapter 12 in State of South-east Queensland Waterways Report 2001, Moreton Bay Waterways and Catchments Partnership, p.75.
  4. Queensland State Archives Item ID620230

A trip to Toowong Creek

Wanting to take advantage of a perfect autumn afternoon, I hopped on the train and went to look at Toowong Creek. My report is here.

The key word is ‘mangroves’. I had no idea there was an intact tidal section of Toowong Creek until this afternoon, so discovering it was a bit of a thrill.

Then again, the creek at Perrin Park isn’t really intact at all is it? It’s dead straight while the original creek was as winding as the rest of them. Can someone tell me about the history of this place?