This post was updated on 24 May 2013 to include a revised outline of Langsville Creek catchment.
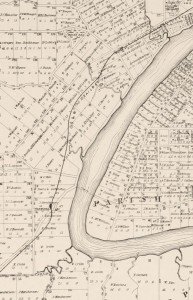
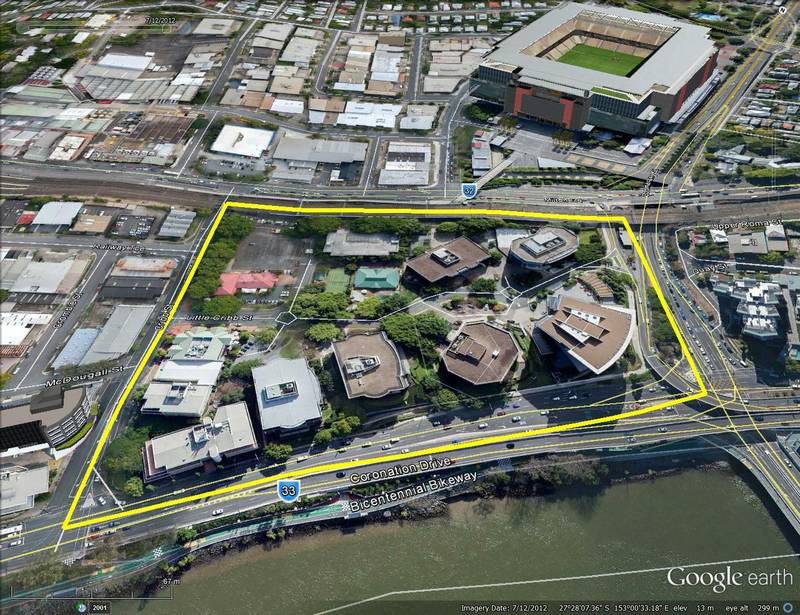
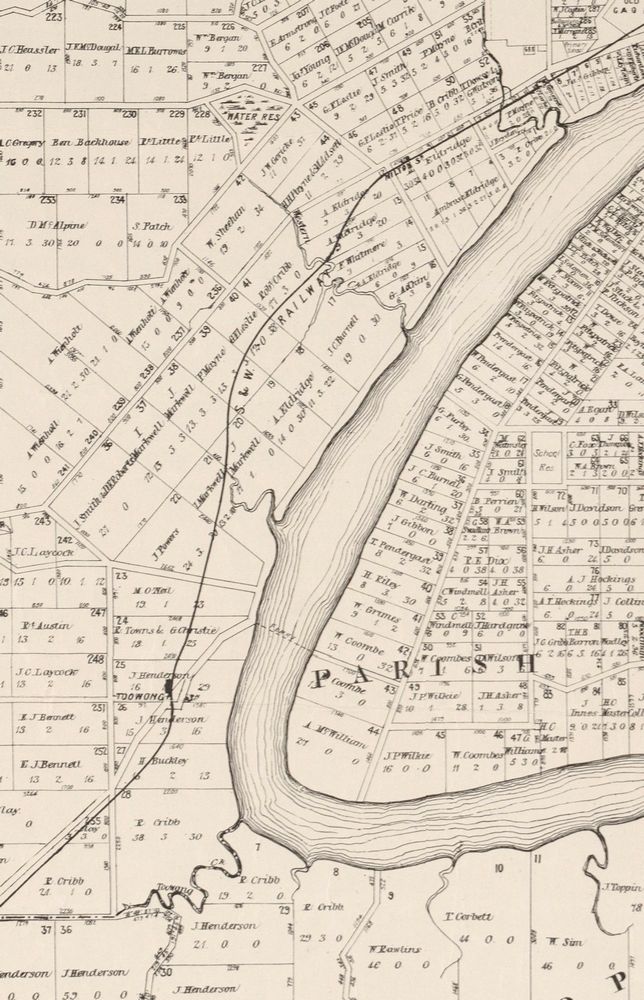
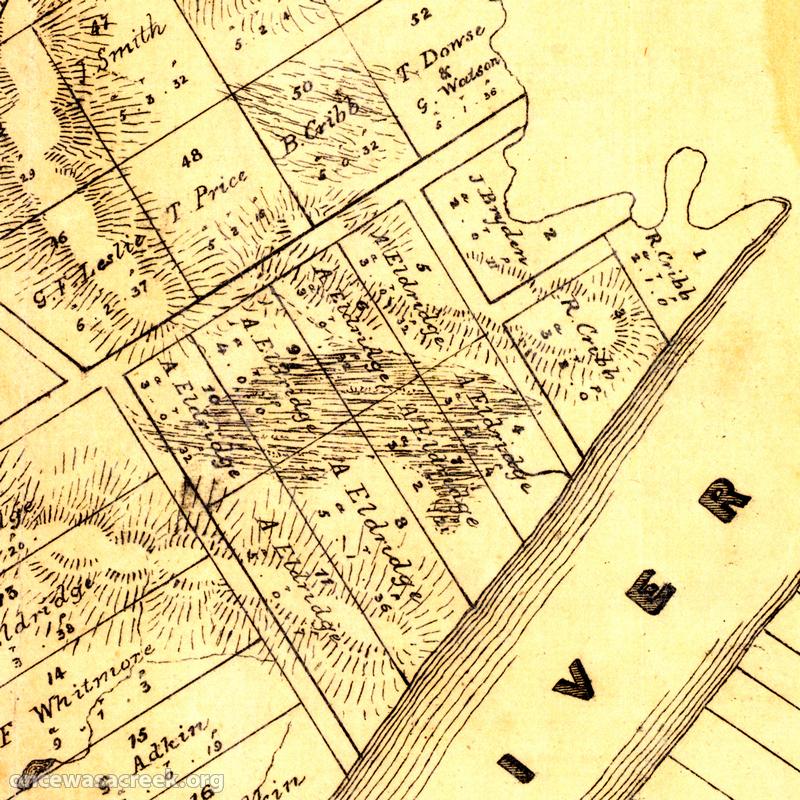
The Milton/Toowong Reach of the Brisbane River, depicted on a map published in 1884
One of the first things I did when I created this website was to map out the catchment of Western Creek. While Western Creek has remained my focus, I have increasingly spent time thinking and writing about its neighbouring catchments as well, especially its three ‘sister’ catchments along what John Oxley called the Crescent Reach: Boundary Creek, Langsville Creek and Toowong Creek. These creeks are visible in several old maps, such as the one shown to the right, which dates from 1884.
I figured that it was about time to put these other catchments onto a map. So, I fired up ArcMap, fed it some digital elevation data and eventually coaxed out of it the catchment boundaries. And of course, I then loaded them into Google Earth. The image below shows, from left to right, the catchments of Toowong Creek, Langsville Creek, Western Creek and Boundary Creek. (I haven’t mapped out the streams of the other catchments — that can wait for another day.)
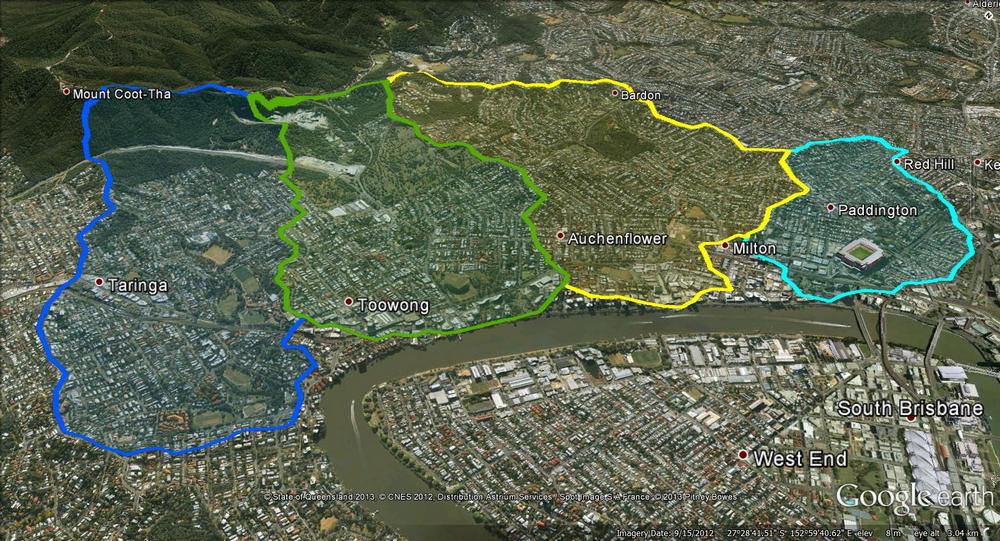
The catchments of the Crescent Reach. From left to right: Toowong Creek, Langsville Creek, Western Creek and Boundary Creek.
The precision of these boundaries is limited by the data used to create them, and you can tell by their jagged shapes that they are only approximations. Defining these boundaries can get particularly tricky as you get closer to the river, where the terrain is relatively flat.
But these boundaries don’t have to be perfect in order to be useful. The most interesting thing that they convey is the overall shape and size of the four catchments. At a glance, we can see that Boundary Creek is the smallest, while Toowong Creek and Western Creek are the largest. Using my GIS software, I calculated the catchment areas as follows:
Western Creek: 4.1 km2
Toowong Creek: 3.9 km2
Langsville Creek: 3.3 km2
Boundary Creek: 1.5 km2
I was surprised to discover that the Toowong Creek and Western Creek catchments are about the same size. I had always assumed that Toowong Creek was larger, and that this might be one reason why it (mostly) survived while Western Creek was (mostly) obliterated. But since their catchments are about the same size, their streams (at least in the lower reaches) should also have been comparable. Does this mean that we can use Toowong Creek as a reference point to tell us what Western Creek might have been like? Maybe, maybe not, as I suspect you would have to account for any notable differences in the geology, vegetation, topography and overall shape of the two catchments first. It is an interesting prospect, though.
Over the hill and far away
All four of these catchments share their uppermost boundaries with another catchment: that of Ithaca Creek. Ithaca Creek begins in the slopes of Mount Coot-tha and flows through Bardon, Ashgrove and Red Hill, where it meets its ‘parent’ stream, Enoggera Creek. The catchments of Ithaca Creek and Enoggera Creek are both shown in the image below, along with the four catchments of the Crescent Reach.
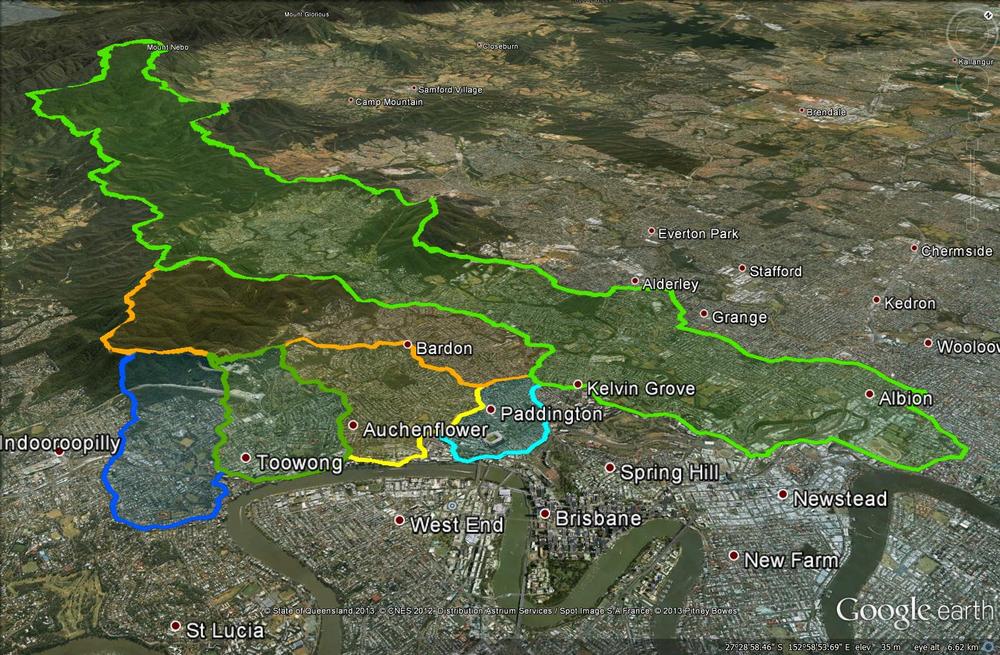
The four catchments of the Crescent Reach along with the larger catchments of Ithaca Creek and Enoggera Creek.
Ithaca Creek’s catchment covers an area of 11 km2 — almost as much as the four Crescent Reach catchments combined. But it too is dwarfed by the catchment of Enoggera Creek, which covers about 76 km2 (including Ithaca Creek, which is one of its tributaries) and extends all the way up through The Gap and into the D’Aguilar Range. No wonder Enoggera Creek was chosen to provide Brisbane’s first large-scale water supply.
And the rest of Brisbane? It could be mapped like this, too. In fact, I’d be surprised if the council hasn’t done it already, since these same catchments would delineate the networks of sewers and stormwater drains that the council maintains. And of course, where notable creeks still exist, their catchments will have been mapped to support monitoring and management initiatives such as Healthy Waterways. I hope that at some stage, this information will be made available for people to explore through Google Earth or similar platforms.
For now, you’ll have to make do with the six catchments I’ve discussed above. If you have installed Google Earth, then you can explore them yourself by opening (or downloading then opening) this file.