Note – the pictures in this post contain two images, which flip back forth when you hover your mouse over them. On a mobile device these images will switch when you touch them, and then switch back when you scroll away … if you are lucky. For best results, please view this article on a desktop or laptop.
Time now for something completely different.
This site has reached a point where I am starting to look back, usually with some degree of bemusement, at all that I have written and done over the last two years. For a while now I’ve been meaning to overhaul the site’s structure to better serve the unexpected array of topics that I have ended up covering. But invariably, something more interesting captures my attention. This post is a case in point.
Recently I have been playing with network graphs as a way of visualising concepts and data. Networks are used as an analytical tool across many branches of science, because just about any phenomenon can be understood at some level as a system of discrete but inter-related entities (or nodes, in network-speak). Perhaps the most obvious examples are social groups and computer networks, but a myriad of other things, from gene sequences to ecosystems to economies, have been modelled and explored with the help of network theory. (Check out this page for a some examples of network visualisations.)
Networks are also useful for analysing text, because they can show relationships among words, such as which words occur together most frequently. And the best bit is that we can get computers to do all the counting. We still need to tell the computer which words to look out for, but thankfully there are dictionaries and word-recognition tools that do much of this work as well.
I wanted to have a go at analysing some text, so I found some software1 and fed it a collection of eleven of my own essays from this website.2 The result, shown below, is a kind of word-map of the topics covered by the eleven articles. In this case, the topics are limited to the names of people and locations, simply because these are much easier to identify than other kinds of topics. In the future, I hope to bring other topics (floods, maps, roads, etc.) into the mix.
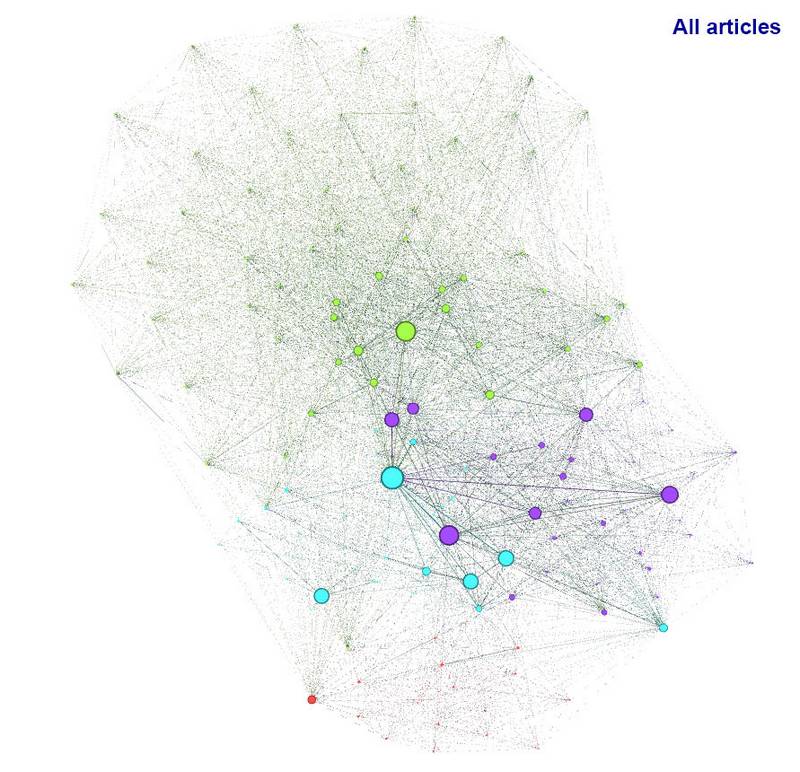
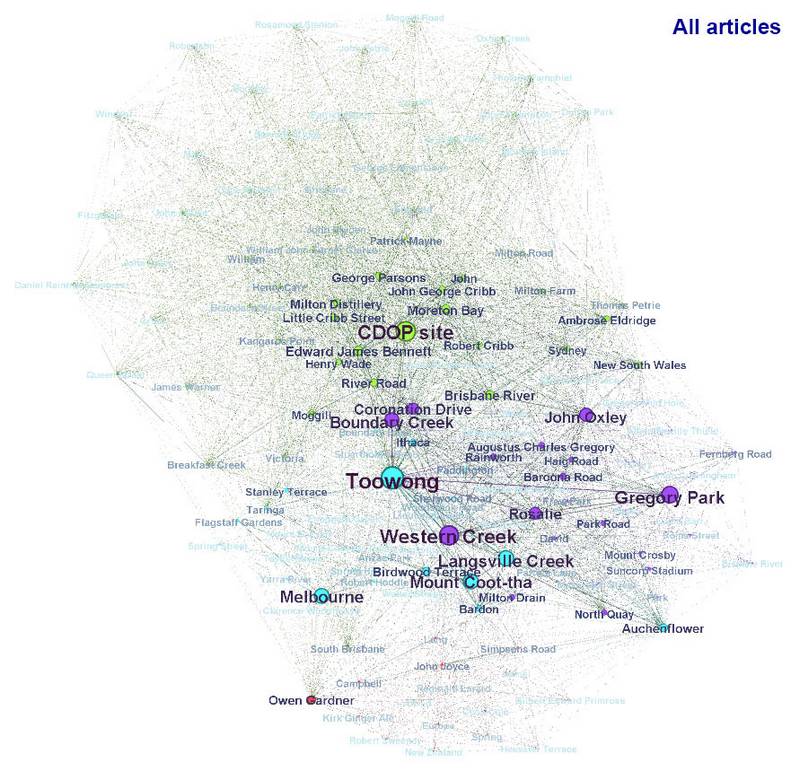
The network of all people and places mentioned in the eleven articles. Node size reflects term frequency, and line thickness reflects the strength of co-occurrence. Hover over the image to see the network with the labels removed.
Notes:
- There are various packages out there, some free and some commercial, but the one that I used is called KNIME. It has an intuitive graphical interface, which means you don’t need to know any code. ↩
- The essays were: A history of Gregory Park, John Olxey and the chain of ponds, Milton: Brisbane’s western frontier, The waters of Milton, Bottles and cans (an adventure in suburban archaeology), The broken lands of Toowong, Topography shock: postcards from the south, The history of the Coronation Drive Office Park, and the three installments of Uncovering Langsville Creek. ↩