Note – the pictures in this post contain two images, which flip back forth when you hover your mouse over them. On a mobile device these images will switch when you touch them, and then switch back when you scroll away … if you are lucky. For best results, please view this article on a desktop or laptop.
Time now for something completely different.
This site has reached a point where I am starting to look back, usually with some degree of bemusement, at all that I have written and done over the last two years. For a while now I’ve been meaning to overhaul the site’s structure to better serve the unexpected array of topics that I have ended up covering. But invariably, something more interesting captures my attention. This post is a case in point.
Recently I have been playing with network graphs as a way of visualising concepts and data. Networks are used as an analytical tool across many branches of science, because just about any phenomenon can be understood at some level as a system of discrete but inter-related entities (or nodes, in network-speak). Perhaps the most obvious examples are social groups and computer networks, but a myriad of other things, from gene sequences to ecosystems to economies, have been modelled and explored with the help of network theory. (Check out this page for a some examples of network visualisations.)
Networks are also useful for analysing text, because they can show relationships among words, such as which words occur together most frequently. And the best bit is that we can get computers to do all the counting. We still need to tell the computer which words to look out for, but thankfully there are dictionaries and word-recognition tools that do much of this work as well.
I wanted to have a go at analysing some text, so I found some software1 and fed it a collection of eleven of my own essays from this website.2 The result, shown below, is a kind of word-map of the topics covered by the eleven articles. In this case, the topics are limited to the names of people and locations, simply because these are much easier to identify than other kinds of topics. In the future, I hope to bring other topics (floods, maps, roads, etc.) into the mix.
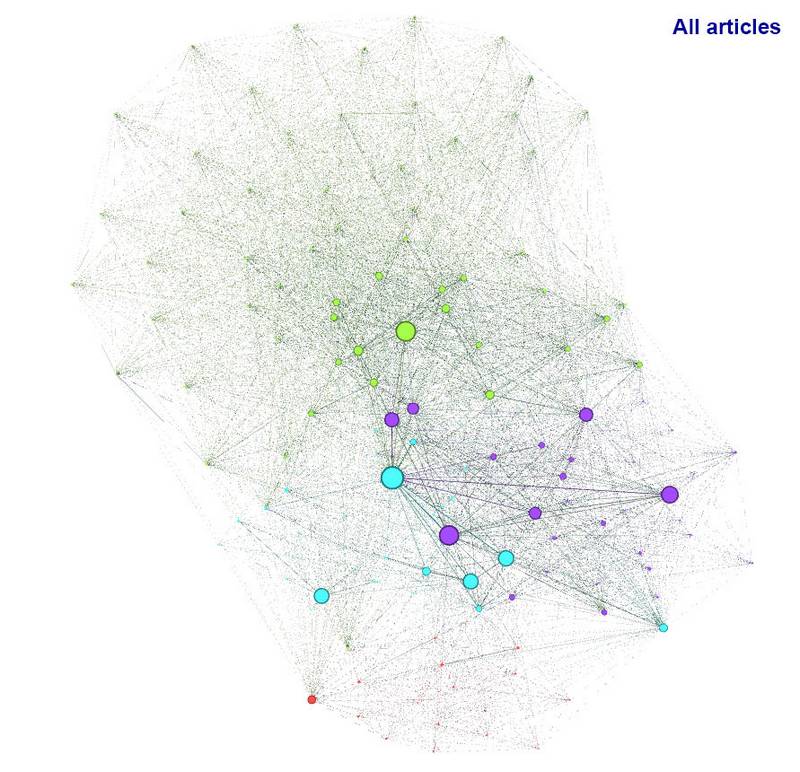
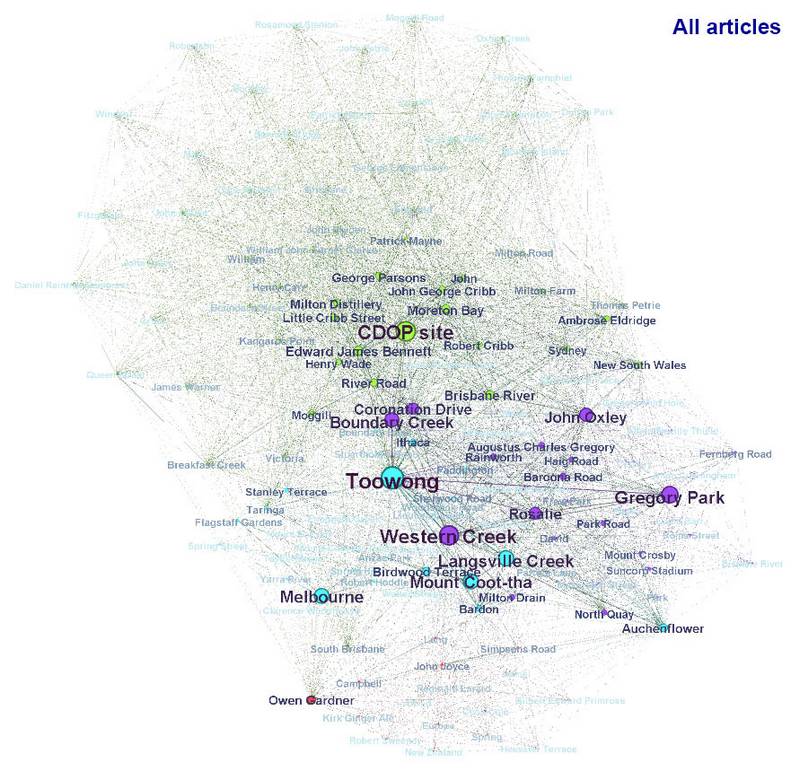
The network of all people and places mentioned in the eleven articles. Node size reflects term frequency, and line thickness reflects the strength of co-occurrence. Hover over the image to see the network with the labels removed.
The size of a node and its label reflects the frequency of that term within the collection of articles. So you can see in the graph above that ‘Toowong’, ‘Gregory Park’, ‘CDOP site’ (the Coronation Drive Office Park) and ‘Western Creek’ are among the most frequently occurring terms. The lines between terms indicate the frequency of their co-occurrence. There is a strong connection, for example, between Toowong and Gregory Park, meaning that those two terms occur frequently in close proximity to one another. A faint connecting line means that the two terms probably only occur once or twice in the same article, and rarely within the same sentence or paragraph. I should mention that in developing these graphs I removed some terms (Milton, Brisbane and Australia are three that I can recall) that added little value because they occurred so frequently and connected to just about everything.
The nodes are coloured according to the natural clusters of the graph, which the graphing software (called Gephi) identifies automatically.
Exploring the wordscape
I was curious to see where each individual article sat within this overall topic-space (or ‘wordscape’?), so I resized the nodes on the graph to reflect the frequency of terms within each article rather than across the collection. The beauty of doing this is that you can see which topics any two articles share in common. The first image below compares the terms in the article about the history of the Coronation Drive Office Park (the ‘CDOP site’) to those in the article about the history of Gregory Park (I should stress again that the transition between the two might not work so well on a mobile device). The article about the CDOP site accounts for most of the terms in the upper part of the graph. It covers more people and places than any other article, and many of these people and places are not mentioned elsewhere. A few, however, such as Ambrose Eldridge, John Oxley, Milton Road and the Brisbane River, play minor parts in both articles, as you can see when you hover over or tap the image.
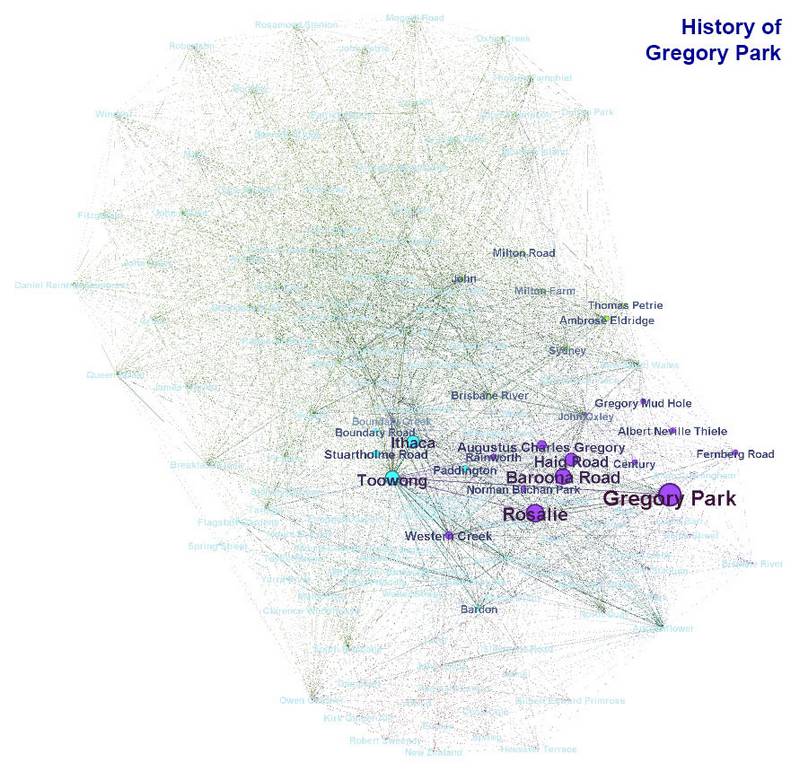
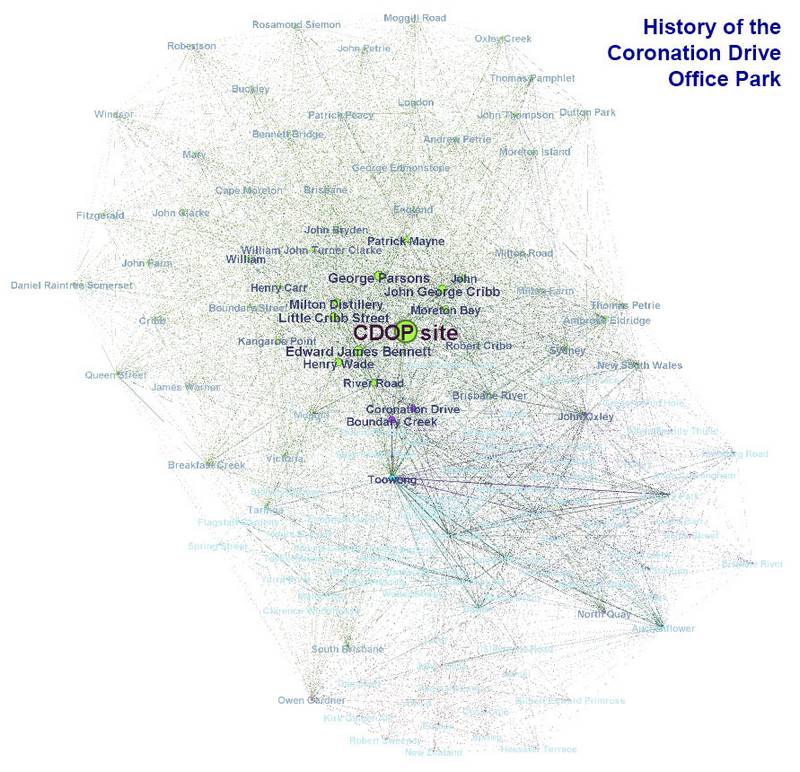
Graphs showing the topics covered by the History of the Coronation Drive Office Park and (if you hover over or tap the image) the History of Gregory Park.
The essay about the bottles and cans that I found in a gully near Mount Coot-tha mostly occupies its own corner of the graph. This is not surprising, because I have not discussed the history of Brisbane’s soft drink industry anywhere else. But this article connects to the rest of the graph because it also discusses places like Western Creek, Mount Coot-tha and Auchenflower. Apparently it even mentions John Oxley, who is the subject of the other graph in this image. The cluster of topics from John Oxley and the chain of ponds includes Allan Cunningham, who joined Olxey on his 1824 survey of the Brisbane River, as well as some of the places that Oxley visited in that expedition, such as Mount Crosby, Langsville Creek, Western Creek and Frew Park.
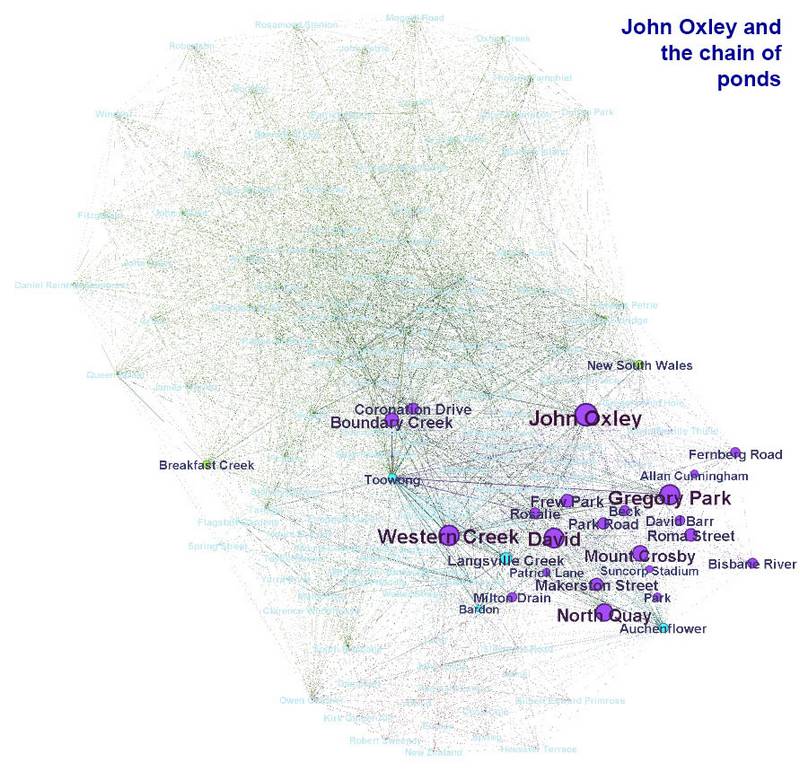
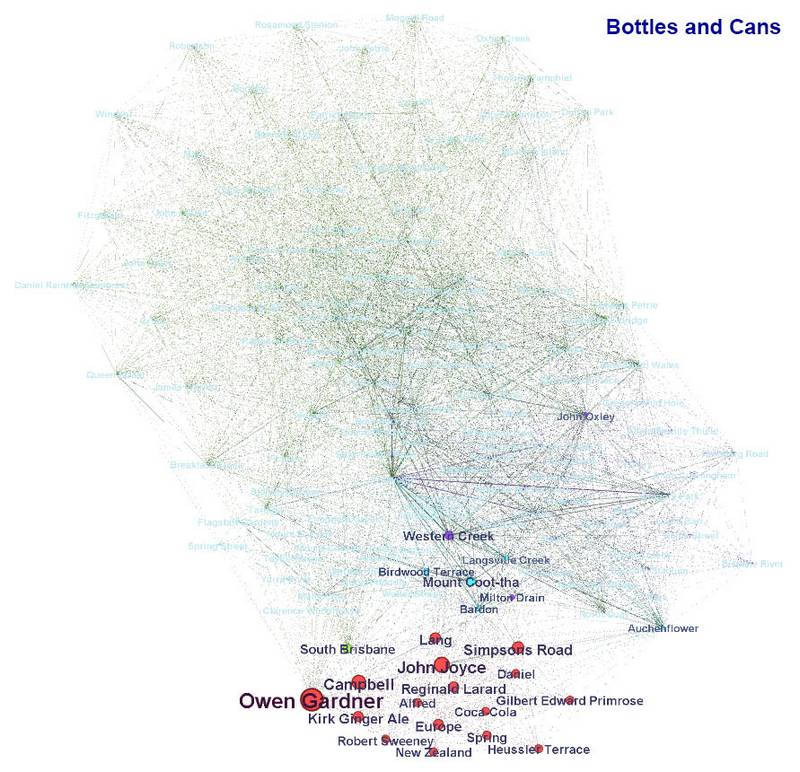
Graphs showing the topics covered by Bottles and cans and (if you hover over or tap the image) John Oxley and the chain of ponds.
The broken lands of Toowong makes special mention of places like Stanley Terrace and Sherwood Road (Miskin Street also featured heavily but was missed by the tagging process). It also connects to topics that are more the focus of other articles, such as Edward James Bennett (the government draftsman who lived at the CDOP site) and Melbourne, which is the subject of the second article in the image. Topography shock deals mostly with Melbourne landmarks, but it also mentions places like Mount Coot-tha and Bardon which are more central to the rest of the graph.
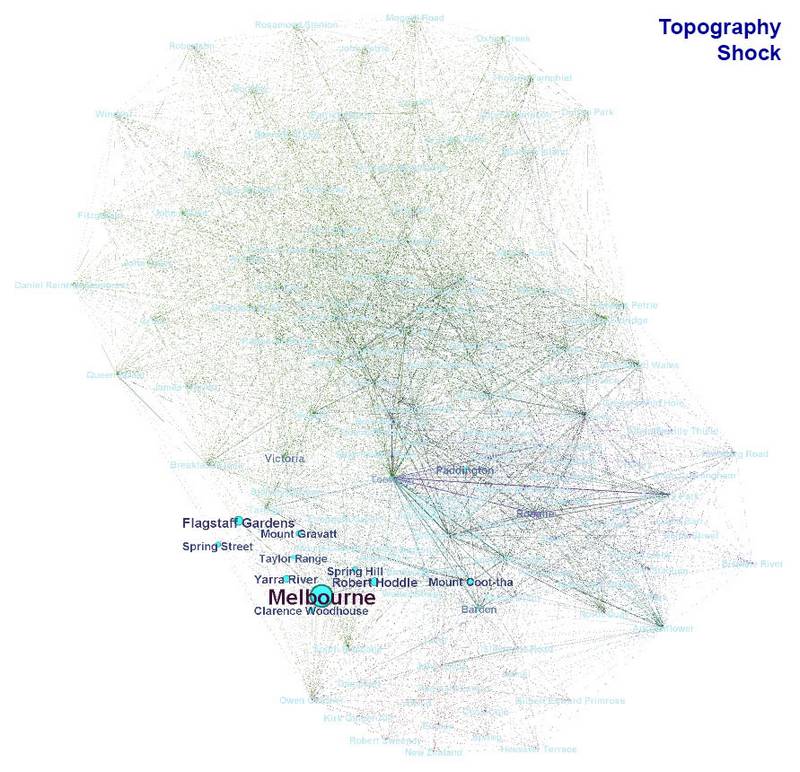
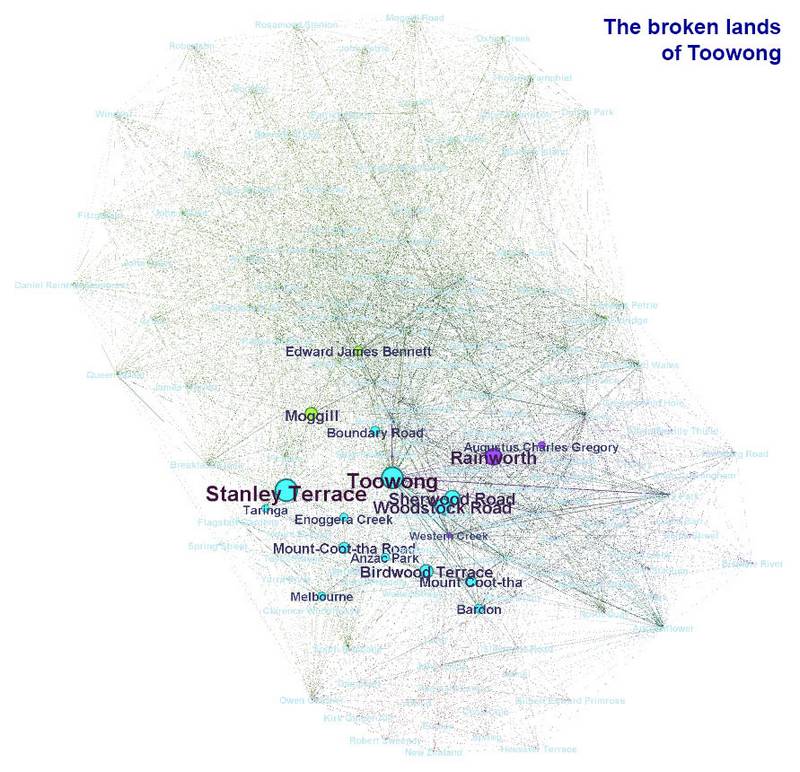
Graphs showing the topics covered by The broken lands of Toowong and (if you hover over or tap the image) Topography Shock.
The final image compares the two articles about Milton. The Waters of Milton, which explores a survey plan by James Warner, focuses on just a few locations, mostly in the Boundary Creek area. Brisbane’s western frontier, on the other hand, discuses several different locations as well as the early residents of the Milton area.
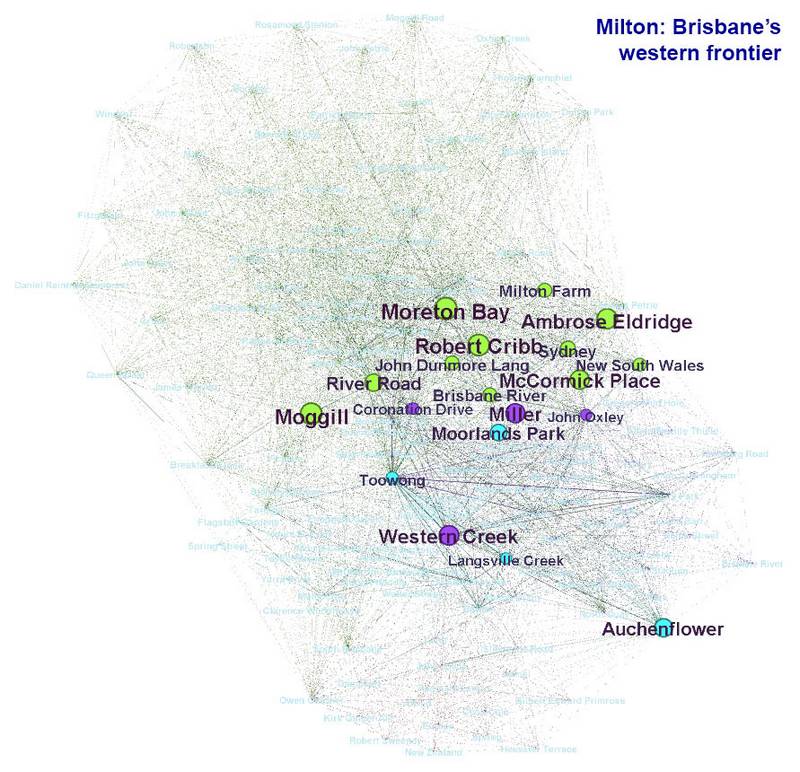
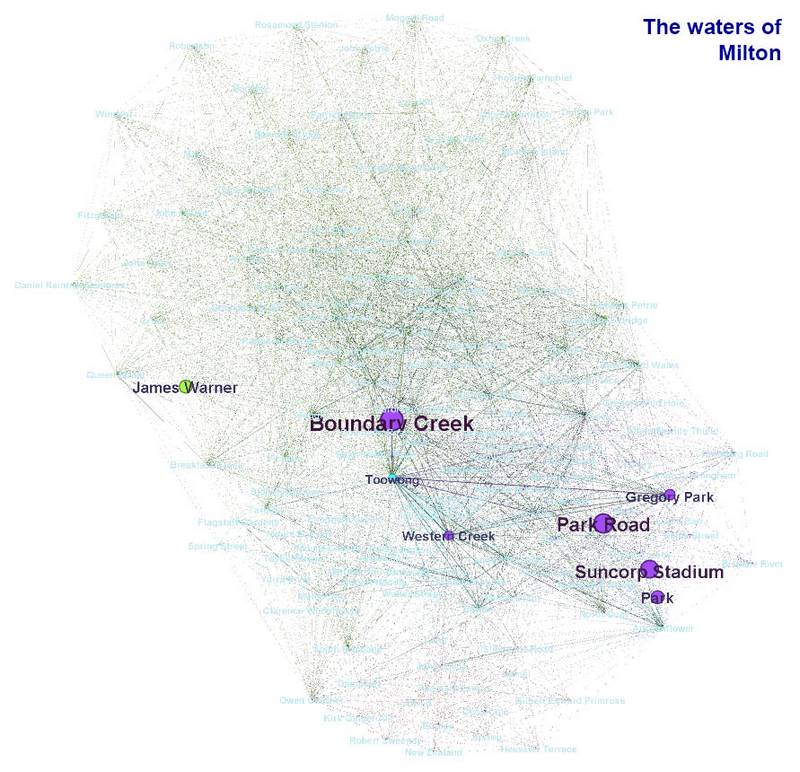
Graphs showing the topics covered by The waters of Milton and (if you hover over or tap the image) Milton: Brisbane’s western frontier.
Not included in the above are individual graphs for the articles about Langsville Creek, although these contributed to the overall cloud of topics. Being very focused in their content, the Langsville Creek articles occupied only a small and predictable cluster of topics on the graph.
Head in the clouds?
I’m not sure that this exercise revealed much about my site that I didn’t already know, but I find these graphs interesting nonetheless. Perhaps with a bigger (and less familar) library of articles, this technique could provide a useful tool for navigation and classification. For the purpose of conveying the scope of an individual article, the more common way to represent this information is as a tag-cloud, which dispenses with the dots and lines and just shows the words. A tag-cloud for all of the articles that I analysed would look something like this:
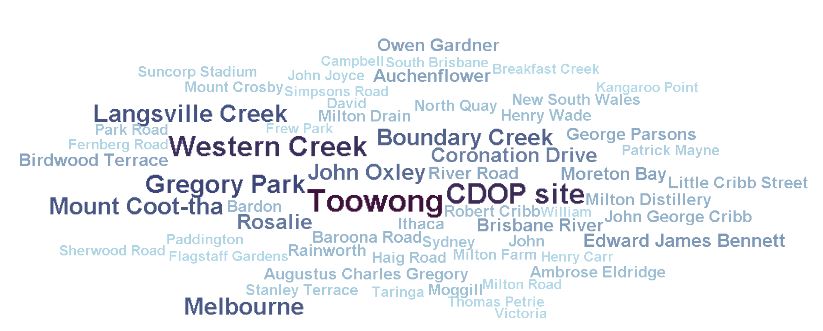
A tag-cloud showing the people and places in all eleven articles.
And the cloud for a single article, in this case John Oxley and the chain of ponds would look like this:
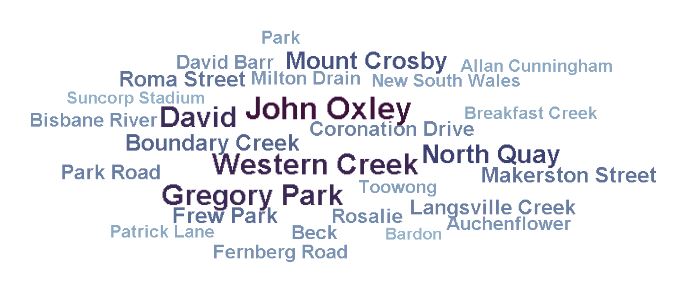
A tag-cloud for the article, John Oxley and the chain of ponds.
These are pretty crummy looking tag-clouds, but you get the idea. If I can make them look nicer I might even use them to index the site. But first I should go and enjoy some of the Easter sunshine.
Notes:
- There are various packages out there, some free and some commercial, but the one that I used is called KNIME. It has an intuitive graphical interface, which means you don’t need to know any code. ↩
- The essays were: A history of Gregory Park, John Olxey and the chain of ponds, Milton: Brisbane’s western frontier, The waters of Milton, Bottles and cans (an adventure in suburban archaeology), The broken lands of Toowong, Topography shock: postcards from the south, The history of the Coronation Drive Office Park, and the three installments of Uncovering Langsville Creek. ↩
Pingback: Adventures in harmonic space | Seen Another Way