Methods
When I started thinking about the course and catchment of Western Creek, my primary method of investigation was simply to walk around and observe the lay of the land. By following the highest and lowest points, you can get a pretty good idea of where the creek flowed, and the extent of its catchment. There are other clues as well, like the location of stormwater drains and culverts.
Direct observations are important if you want to get a feel for how the creek may have once fit into the landscape. But when it comes to recording these observations in the form of a map, this method can be arduous – even in a catchment as small as this one. Thankfully, there are other methods available.
The traditional approach would be to find a topographic map of the area that includes detailed contour lines. This allows you to identify the high and low points without setting foot out the door (except maybe to acquire a map).
Geographical information systems (GIS)
As useful as contour maps are, the digital age has given us an even better way of making maps and working with spatial information: geographical information systems, or GIS. A GIS consists of [software that allows us to analyse and manipulate spatial data]. GIS opens up a whole new world of possiblities … and have application in [almost every industry]. If you’ve used products such as Google Maps, Google Earth, or an in-car global positioning system (GPS) product such as a Tom-tom or Navman, you’ve had a taste of what GISs have to offer. With the right input data (more on that later), GIS software can perform in seconds analyses that might take hours using manual methods. GIS software also allows you to save your spatial features in formats that can be shared and combined with other spatial data to create all manner of maps.
These benefits do come at a cost, as fully-featured GIS software tends to be both expensive and requires some degree of training to use. I have had the opportunity to pick up some basic GIS skills at university (an environmental management degree) and at work (Department of Environment & Resource Management). I am far from an expert — for most tasks I still rely on a good amount of tinkering, Googling and perserverance. For my work on this website I took advantage of the ##-day free trial of ESRI ArcGIS, which is one of the leading commercial GIS software packages (MapInfo is another). When my trial runs out, I’ll consider purchasing a home user (non-commercial) licence (with somewhat reduced functionality) for $100 per year. There are also some free options availble, such as the open-source MapWindow. I haven’t tried this yet, and would be keen to hear from others about their experience with it.
Finding spatial data
GIS software will get you nowhere unless you have some useful spatial data for it to work with. Spatial data exists for just about everything you can think of – natural features, roads, buildings, businesses, you name it. However, getting hold of it is not always easy, as the majority of spatial data resides in the databases of governments, universities and private companies. Thankfully, an increasing amount of data is being made publicly available online, principally by government agencies. The data sources page lists some examples.
The core piece of data that I used for this project is a digital elevation model (or DEM) of South East Queensland. A DEM represents the land as a grid and records a height or elevation for each part of the grid. The smaller the grid size, the more detailed the model, and the greater the accuracy with which we can derive features such as watercourses and catchment boundaries. The DEM that I used has a spatial resolution (grid size) of 25 metres, and a vertical accuracy of +/- 10m. This DEM is provided by the Queensland Department of Environment and Resource Management, and can be downloaded via the Queensland Government Information Service (QGIS).
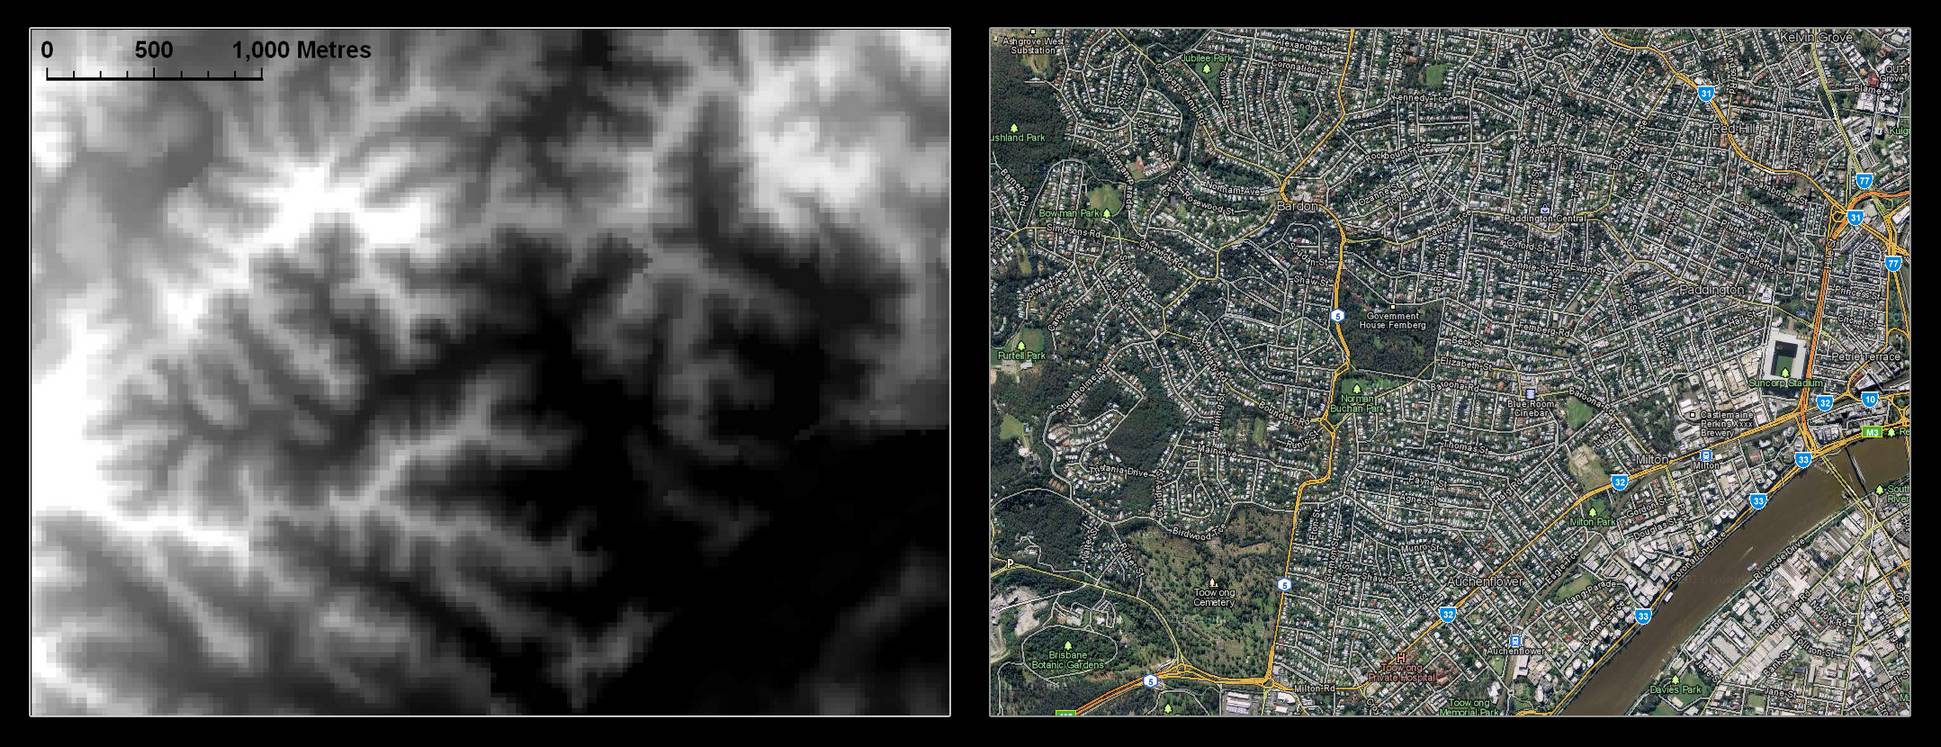
The digital elevation model (DEM) of the Western Creek area, shown beside an aerial image from Google Maps.
Apart from the elevation data, you need what you might call some reference data – something to tell you where you are. An aerial or satellite photo is useful if you can get it. Cadastral boundaries and roads will also help. I used data from the Open Street Map project, which can be imported into ArcGIS 10. But had I known that you can also download cadastral boundaries, roads, and aerial imagery from QGIS, I would hvae used that too. Google Earth and Google Maps provide further ways to reference your data, albeit in a less integrated fashion.
Analysis
To derive the watercourses and catchments of Western Creek from the DEM, I used a selection of hydrology tools included in ArcGIS version 10. These tools analyse the elevation data to infer where water would flow across the terrain.
The streams
The first tool calculates the flow direction (at 45-degree increments) of water at each point on the grid. The next tool uses this information to calculate the cumulative flow at each point. More strictly speaking, it calculates the total number (or area) of grid points draining to each point. The output of this step (shown below) is a depiction of the stream network showing the progressive accumulation of water as you move down the catchment.
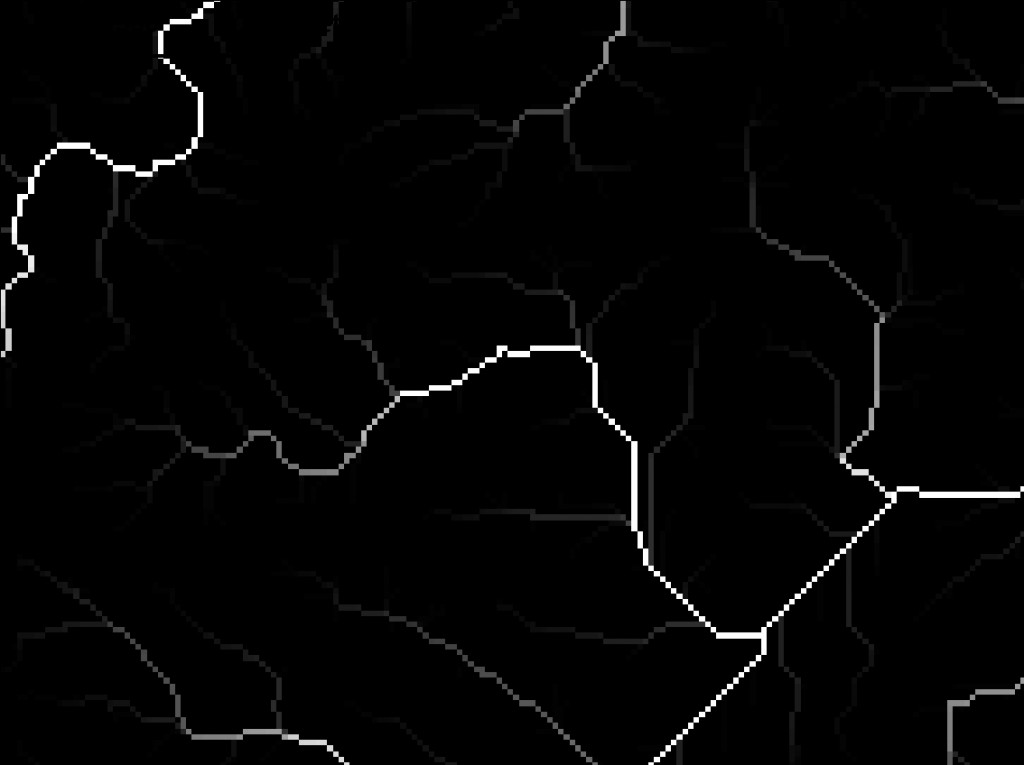
Flow accumulation points calculated using ArcMap, based on the DEM. The brighness of a point reflects the extent of area that drains to it.
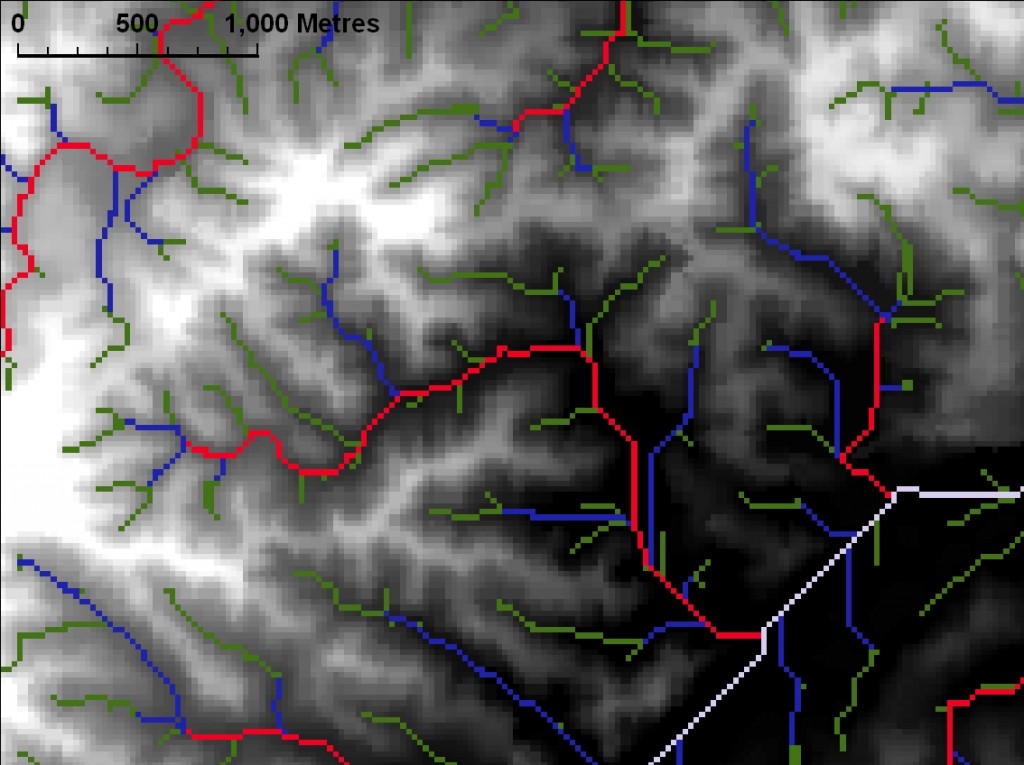
Another tool takes this output and teases out the hierarchy of streams, from the trunk down to the tributaries, as shown below.
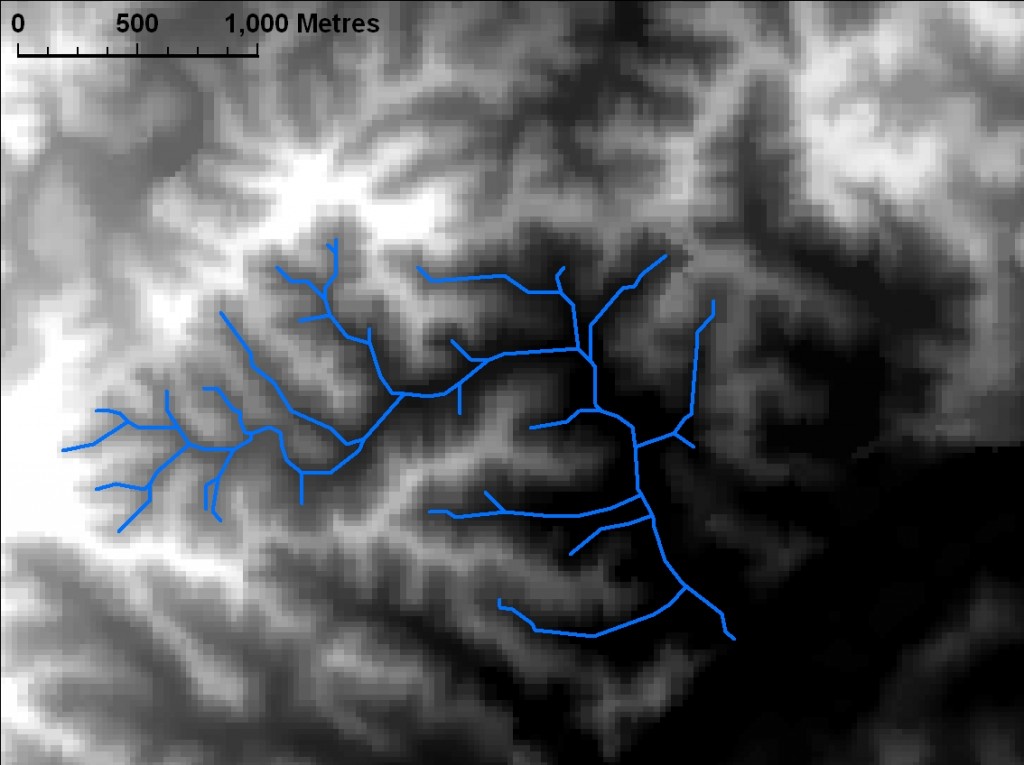
The next step is to convert these ‘raster’ (i.e. grid) outputs into vectors, which can be analysed and transformed much more readily. This is done using another AcrMap tool. The result is shown below (streams outside the Western Creek catchment have been removed).
The catchment
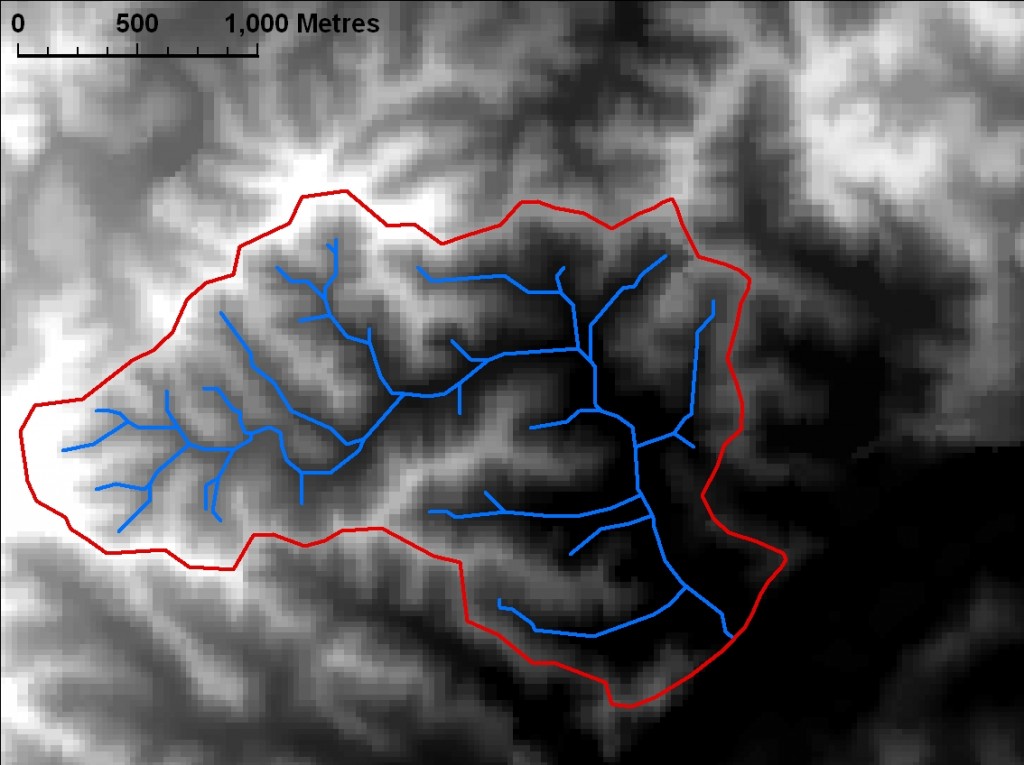
The catchment boundary was derived mapped using the Watershed tool in ArcMap. This tool analyses the DEM to determine the area draining to a given point. If you know what you’re doing you can probably get this to work in one hit, but I had to fiddle around a bit and try a few different points before I got the whole catchment. Once I had these areas, it was a matter of converting the rasters into vector-based polygons, and merging them into a single shape.
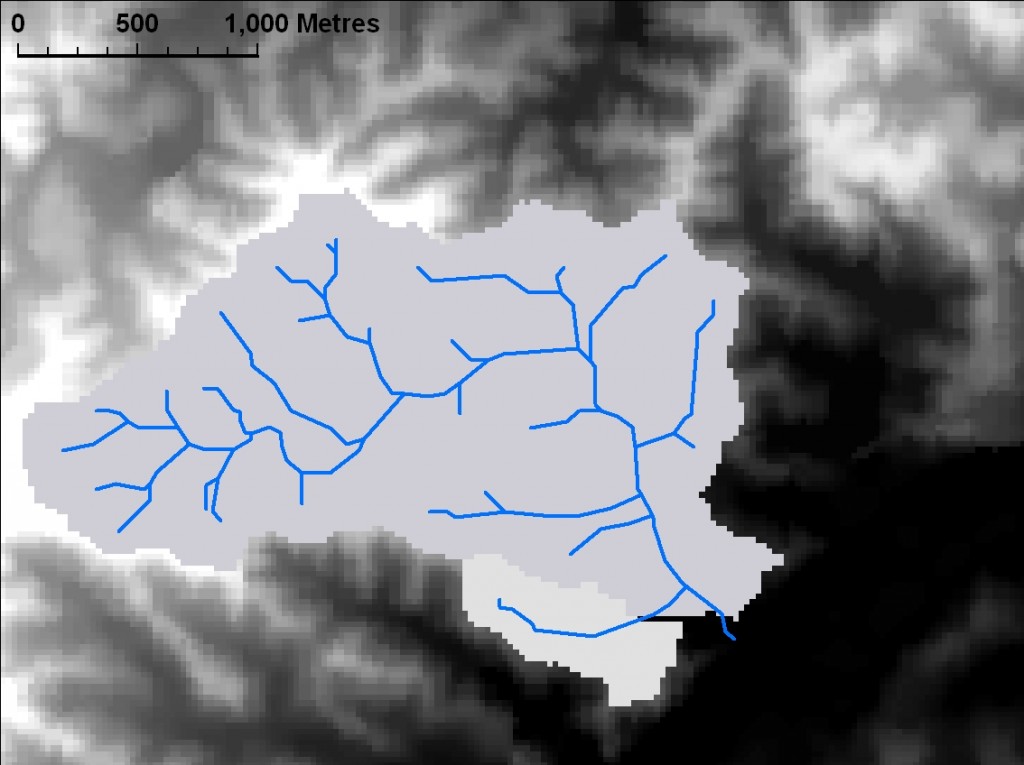
The catchment area for Western Creek, as calculated by ArcMap based on the DEM and derived flow information. Due to my clumsy GIS skills I needed two attempts to cover the whole catchment area, hence the two different shadings.
Touch-ups
It is important to note that the raw outputs from the above process are not perfect. Their accuracy is dictated by that of the DEM, which in this case was around +/- 2.5m in vertical at a spatial resolution of 25m. The overall coarseness of the outputs was not a problem for my purposes, but I did use my own discretion to tweak the outputs here and there to remove unnaturally sharp corners, make minor corrections to the streams, or even remove some tributary streams that seemed inaccurate or insignificant. The vector outputs shown above and elsewhere on the site include these adjustments. Probably the biggest change I made was to align the course of the bottom part of the creek with Milton Drain, so that it is at least consistent with the modern manifestation of the stream. The original shape of the stream at this point (see the image at the top of the home page) here was vastly different to both the original ArcMap output and to Milton Drain.
Enter Google
I converted the ArcMap ‘shape files’ from their native format into .kml files initially with a program called Shape2Earth, and then using the native functionality in ArcMap (once I upgraded from version 9 to 10). These .kml files can be opened in Google Earth and even Google Maps, thus allowing them to be shared and explored without specialised GIS software.
The site itself
I’ve never made a website before. I don’t know what PHP stands for, and my approach to CSS is essentially trial and error. Thankfully, you don’t have to know much about this stuff to run a website anymore. I am using a free platform called WordPress that offers great flexibility and functionality while doing most of the technical stuff for you.
Last modified: April 9, 2012

Greeting from over the ocean. Great post I shall return for more.
Thank you very much for your hard work that went into this site. Very informative and I will be checking out these areas on foot as you write about them!
txnzmf
pj99bk
4lzjkj
40ss0i
awqitb
h5inb5
9j6eua
n57gok