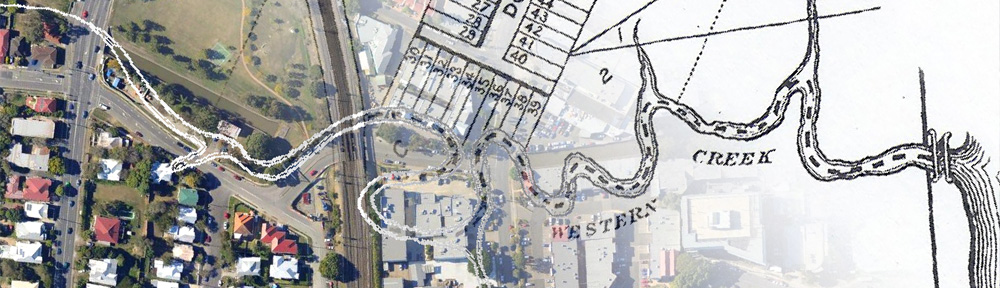
I wrote last week about the backflow prevention device — let’s call it a floodgate — that the council is installing at the end of the Milton Drain to protect the Western Creek drainage system from backflow flooding (that is, flooding from the river rather than from local stormwater). The Western Creek floodgate is the most recent — and probably the most ambitious — in a series of such works being done across Brisbane as part of the City Council’s Backflow Program.
Another place where a floodgate is presently being constructed is the outlet of the Leybourne Street drainage system in Chelmer. This system meets the river as a large open channel at Faulkner Park. There isn’t much of a creek left, and I don’t know what it used to be called. Evidently though, it flooded quite seriously in January 2011.
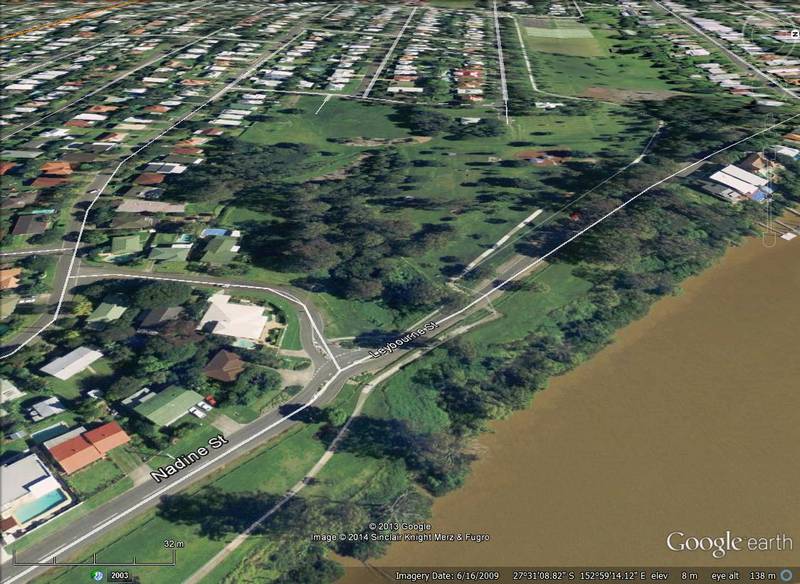
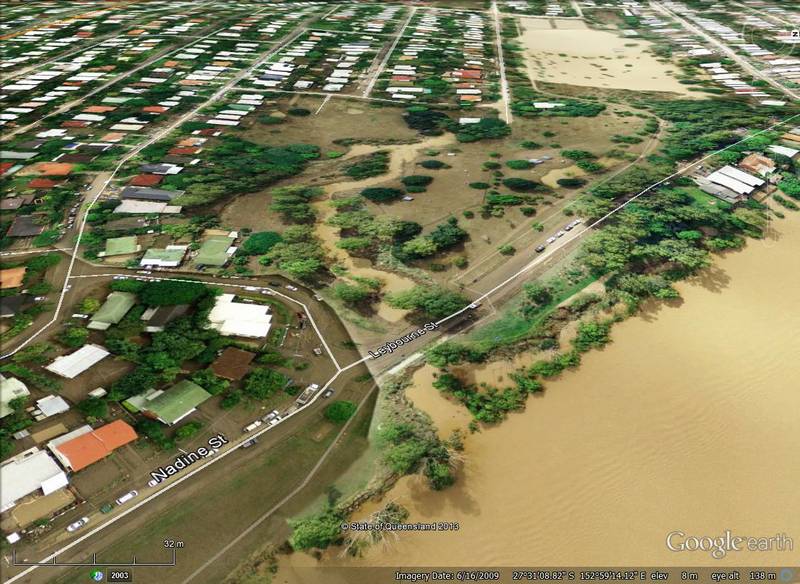
The end of the Leybourne Street drainage system in Chelmer, soon after the peak of the 2011 flood (note that a larger area was flooded — including the road — at the peak). Hover over the image (or tap it if you are using a tablet or smartphone) to see the normal landscape. Flood imagery from Queensland Globe.
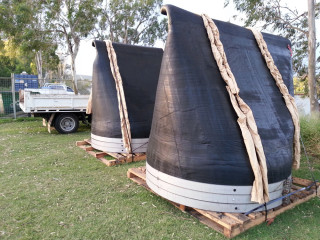
Two large duckbill valves waiting to be installed near Leybourne Street, Chelmer.
I see this place several times a week because I ride past it on my way to work. For some weeks now there has been excavation work going on in the channel on both sides of the road. There have been tractors, trucks, fences, signs, portaloos, the whole works. In this last week, the stars of the show have arrived: two enormous duckbill valves.
Duckbill valves seem to be the City Council’s favoured backflow prevention device, as they are popping up everywhere. There are two already at Milton just downstream from the Western Creek system, and just last weekend I noticed one at Merthyr Park at Newfarm. But the specimens I have seen so far are all modestly sized — certainly less than a metre across. The two at Leybourne Street are of another scale altogether. Each of them must be nearly two metres wide, and in their current position on the grass they stand more than two metres tall (even at full stretch I could not reach their tops). They are made of some sort of very hard rubber-like material — so hard that I have trouble imagining it yielding even to a torrent of stormwater. But this is exactly what these devices have been designed to to, or else they would cause local flooding every time there is a downpour.
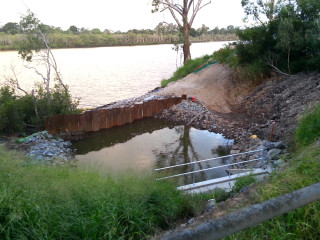
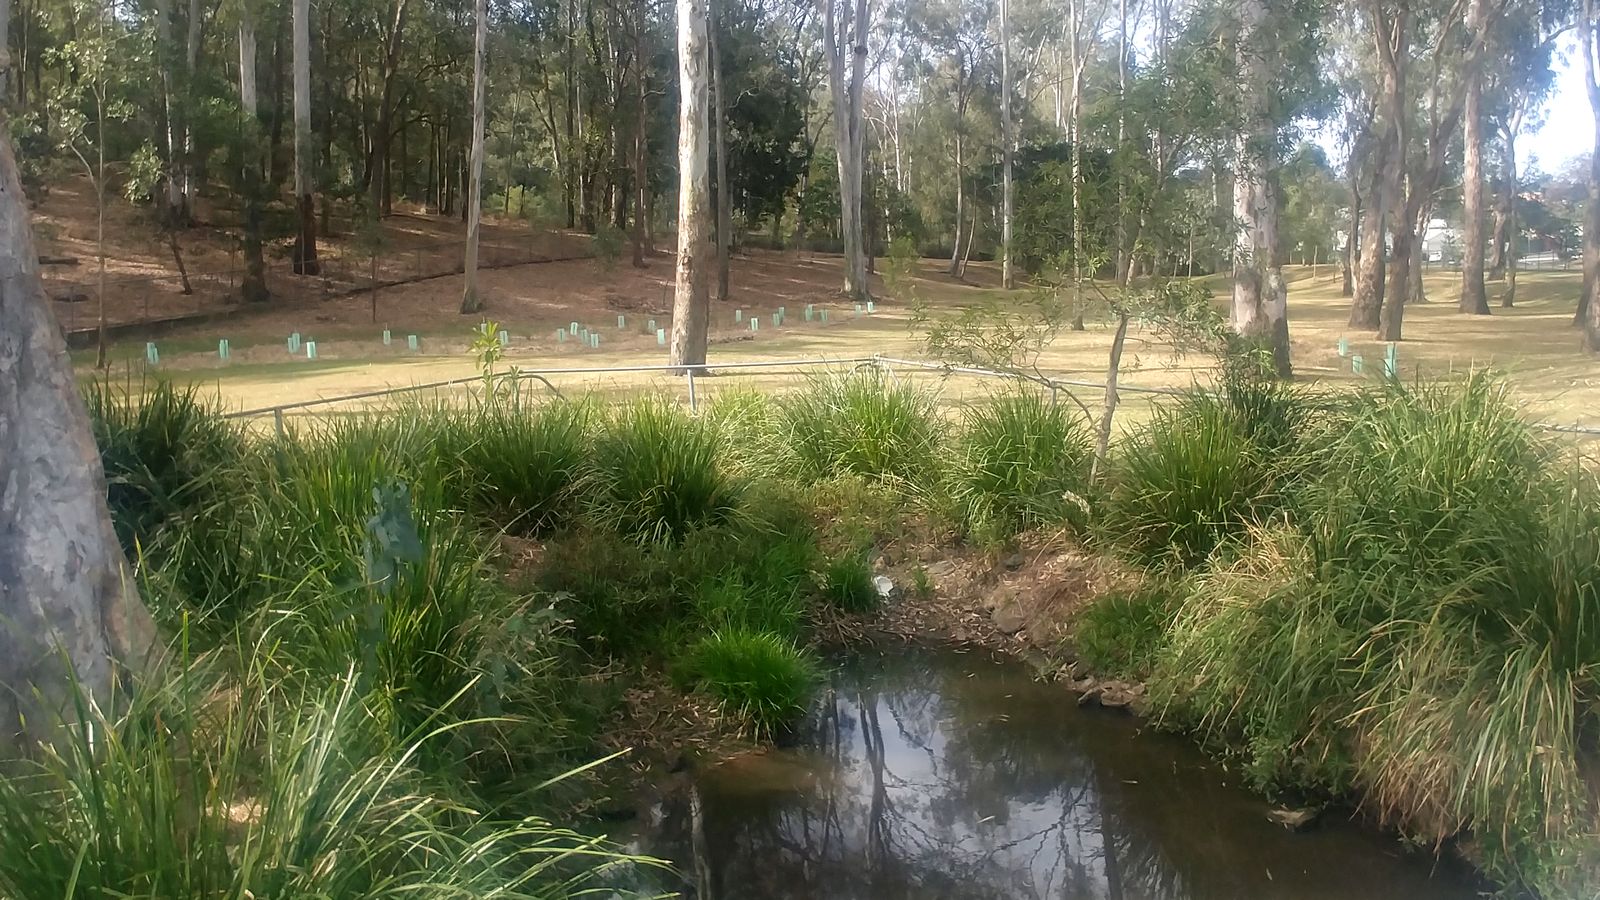
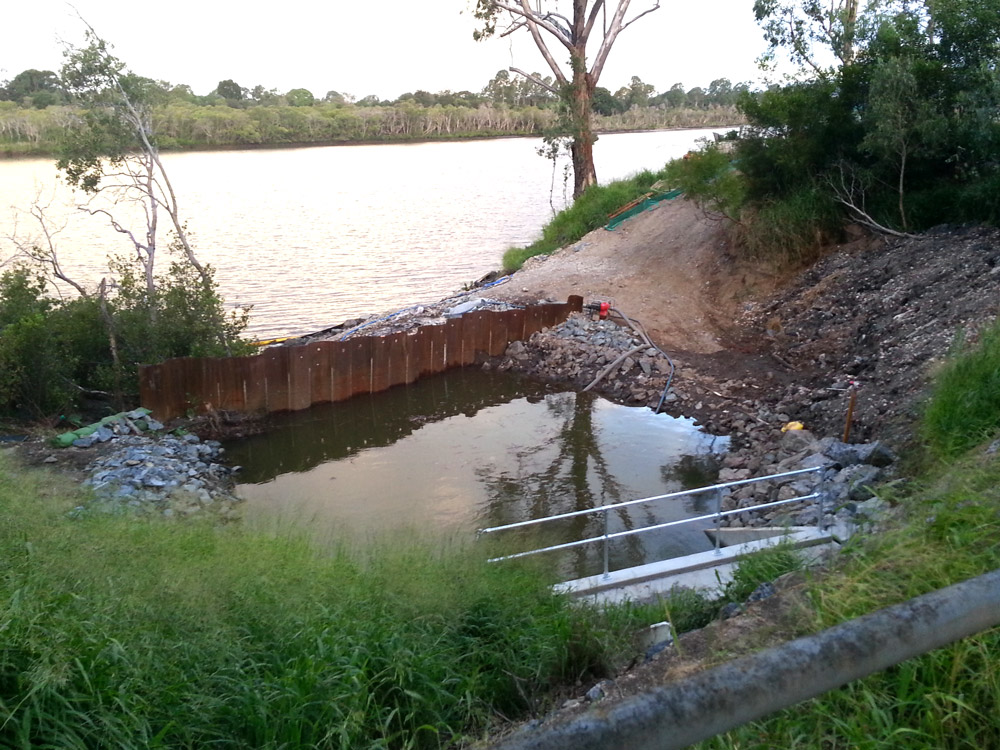
A temporary dam at the outlet of the Leybourne Street drainage system, where the duckbill valves will be installed.
Looking over the embankment towards the river, you can see the new concrete structure into which these duckbills will be fixed. Curiously, the area in front of it has been made into a small temporary dam. I’m not sure why.
These devices will bring some comfort to residents in this area who were flooded in 2011. But it is worth being aware of their limitations. If you look closely at the Queensland Globe flood imagery (best done via Google Earth rather than the image above), you will notice that there is mud all over the road at Leybourne Street. This is a telltale sign that the river broke its banks here, flooding the area directly rather than just through the drains. Indeed, the river spilled over the banks for much of the length of the Chelmer Reach. This means that the two duckbill valves, as big as they are, will not protect this drainage system from a flood as high as 2011 unless the bank itself is raised. Even so, they will hold off the flood until the riverbank is breached, and should stop most floods that are below the 2011 mark.
These are not the sort of devices that I expect to see installed at Western Creek, where to have any real impact a floodgate will need to fill up the large space around the footbridge under Coronation Drive. But as the Backflow Program proceeds, I will be curious to see if any duckbills appear that are bigger than these two.
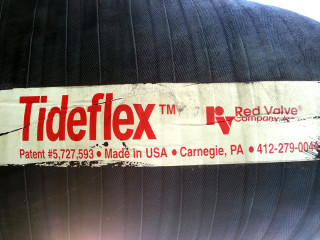
A sticker showing the manufacturer of the two big duckbill valves.
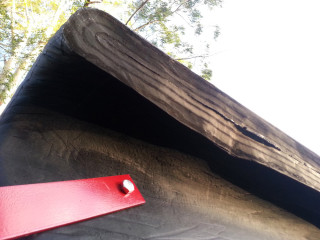
The tip of the duckbill valve. The rubber is thick and hard, but will open up when there is enough water pressure behind it. We hope.
UPDATE – 11 August 2014
The duckbills have of course been in place for some time now, but I only recently got around to checking them out. When I visited, there was a small but constant stream of water trickling through one of the valves, as you can see in this short video.
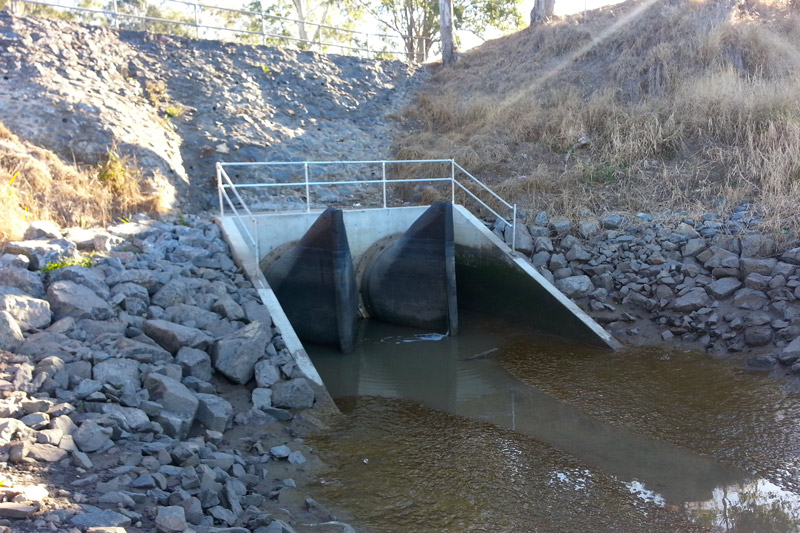
The installed duckbill valves. If you look closely, you can see some water trickling through the one on the right.