Navigating the history of Norman Creek

While I continue to neglect my own website, I did recently find time to contribute to someone else’s. In collaboration with Trish FitzSimons, who recently produced a wonderful series of short films featured in the Museum of Brisbane’s Navigating Norman Creek exhibit, and with support from the Brisbane City Council’s Community History Grant, I contributed to two pages about the history of Norman Creek for the website of the Norman Creek Catchment Coordinating Committee, or N4C.

The first of these two pages explores a plan of Norman Creek drawn in 1839 by the government surveyor James Warner. This plan, held today by the Queensland Museum of Lands, Mapping and Surveying, is a real treasure. It traces the entire length of Norman Creek, from its headwaters in Mount Gravatt to its junction with the Brisbane River. Warner not only depicted the course and form of the stream, but also described the surrounding terrain and vegetation as it was before Brisbane had developed beyond the penal settlement at the site of the modern CBD. His plan links us to the natural history of what is now a highly urbanised catchment.

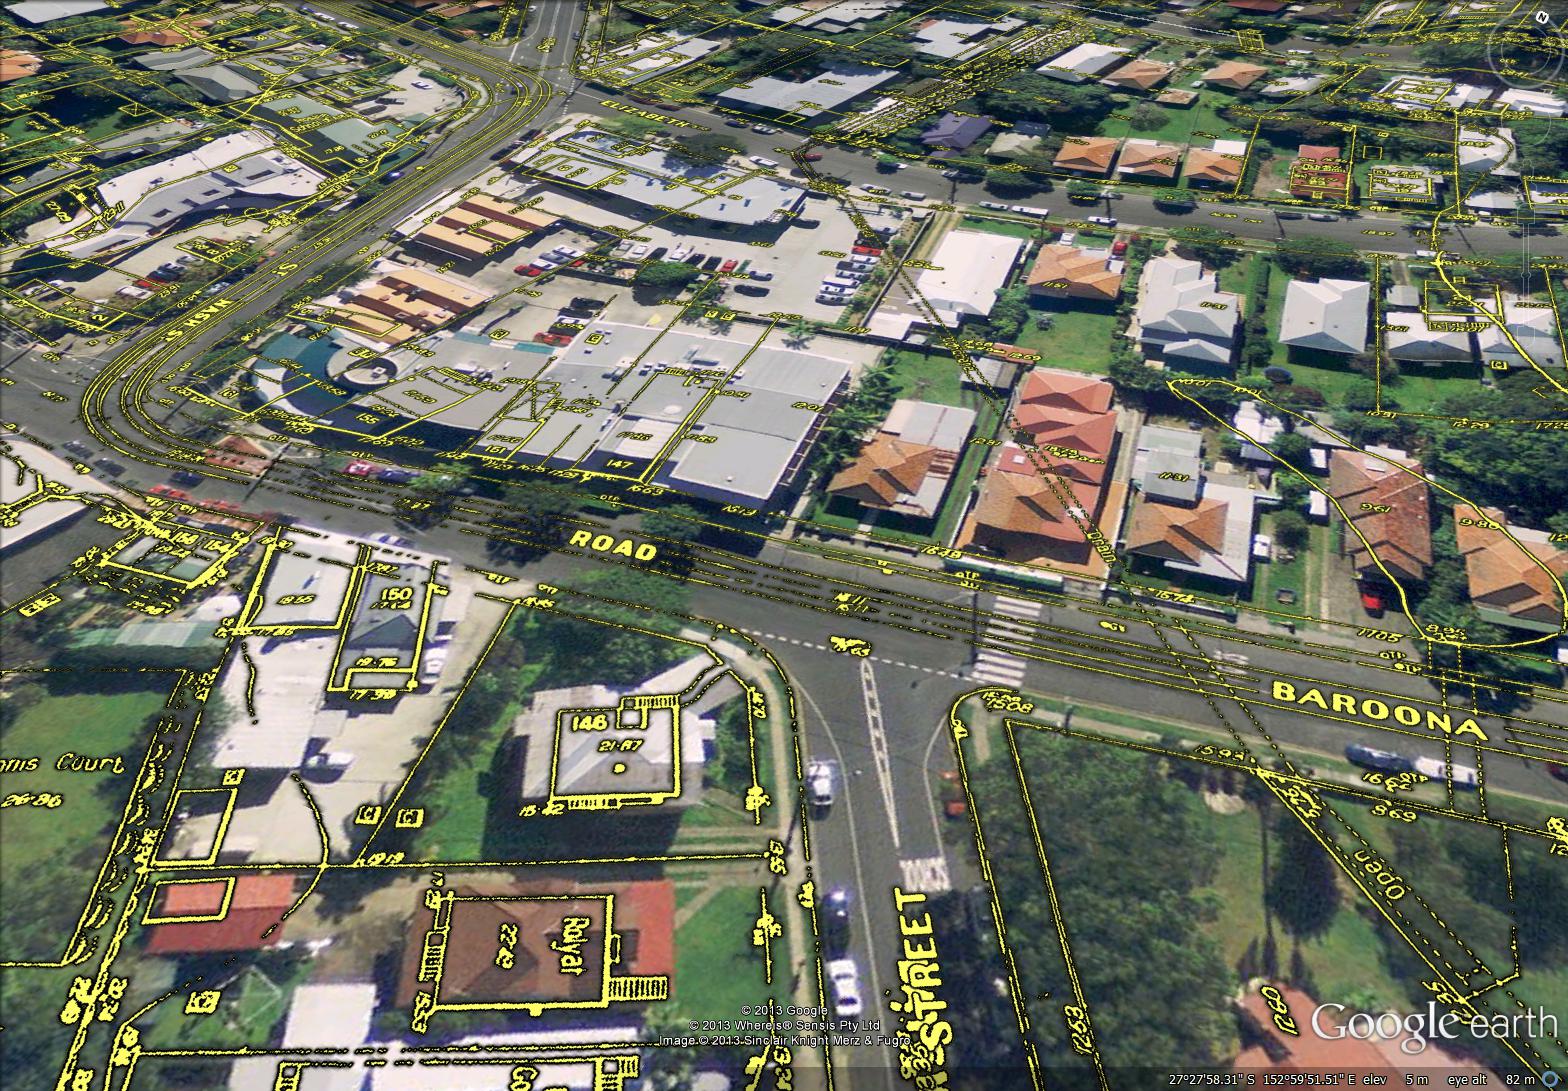
The page, Navigating Norman Creek: Maps from 1839 and 2015, provides a guided tour of Warner’s plan, using Google Earth (in combination with some other special magic) to show how the features on the plan correspond with today’s suburban landscape. The image below is just one example.

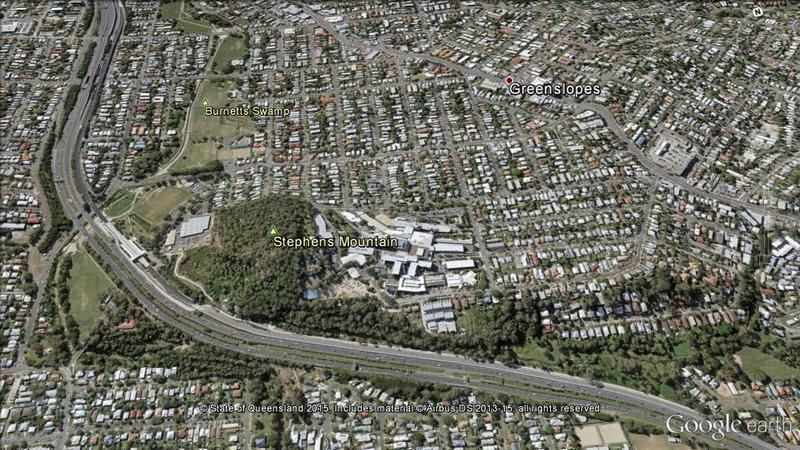
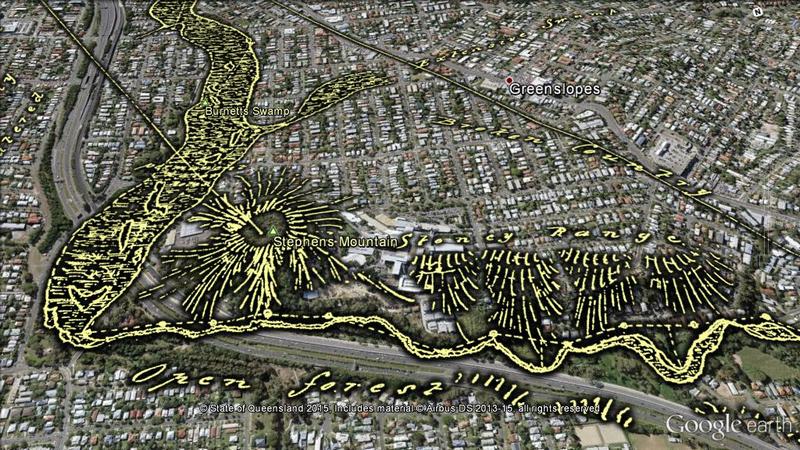
Warner sketched an open forest and a stoney range on either side of what is now the Pacific Motorway as it passes the Greenslopes Hospital. Downstream, he found a large swamp that has since become parkland.

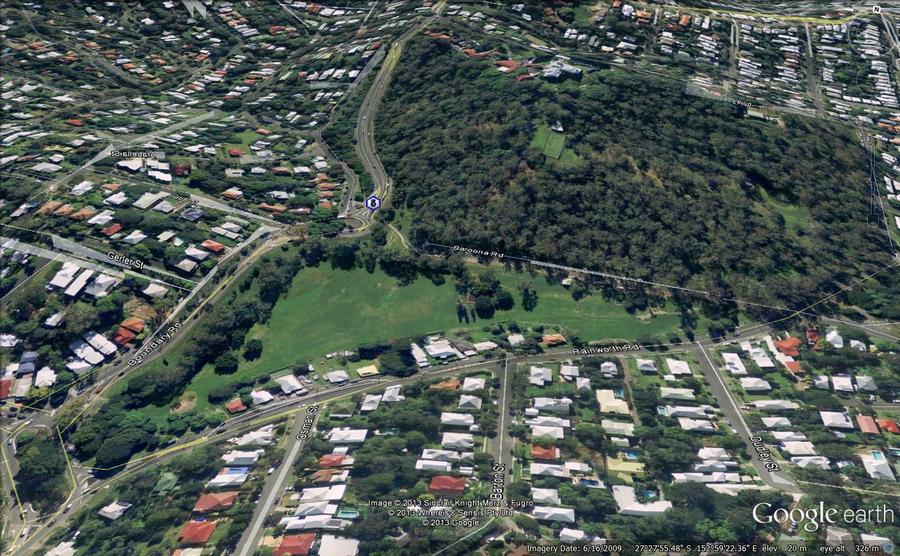
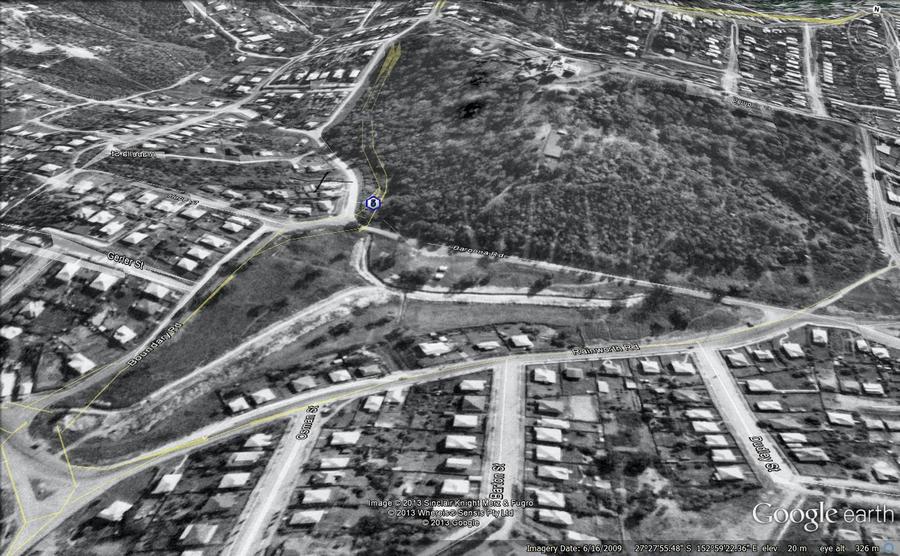
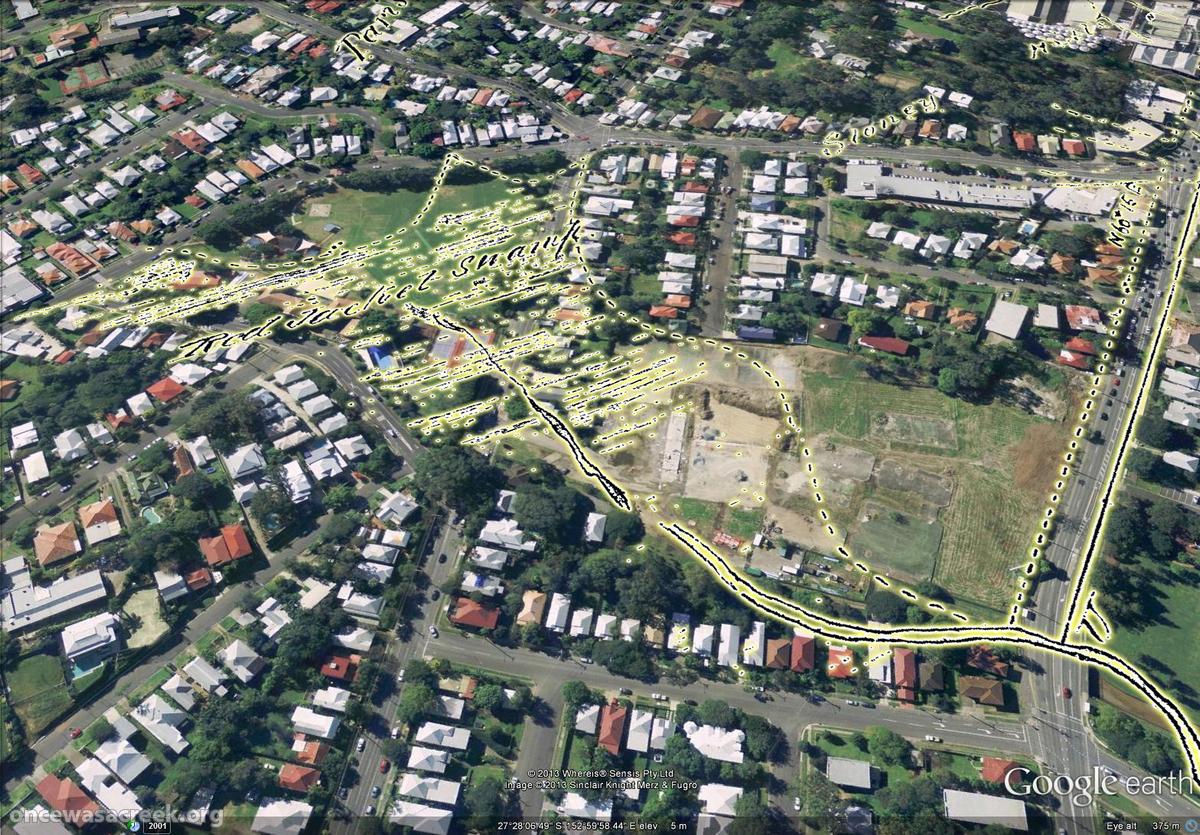
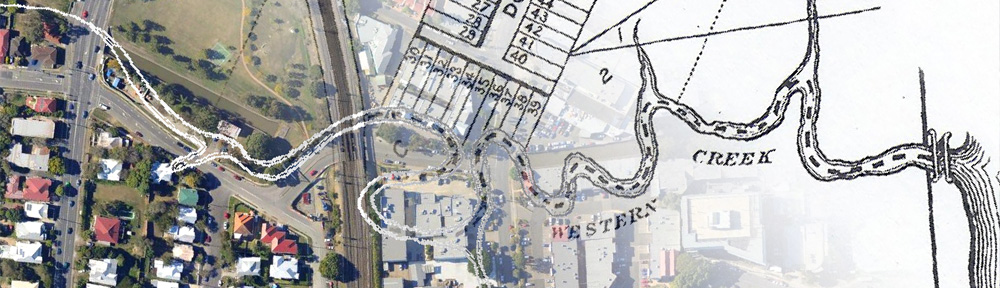
The second page explores another slice of Norman Creek’s history, this time via the 1946 aerial imagery of Brisbane. The image below, which will transition to the modern landscape if you hover your cursor on it (or touch it if you are using a mobile device), illustrates the level of modification that the creek has undergone since the middle of the 20th century.

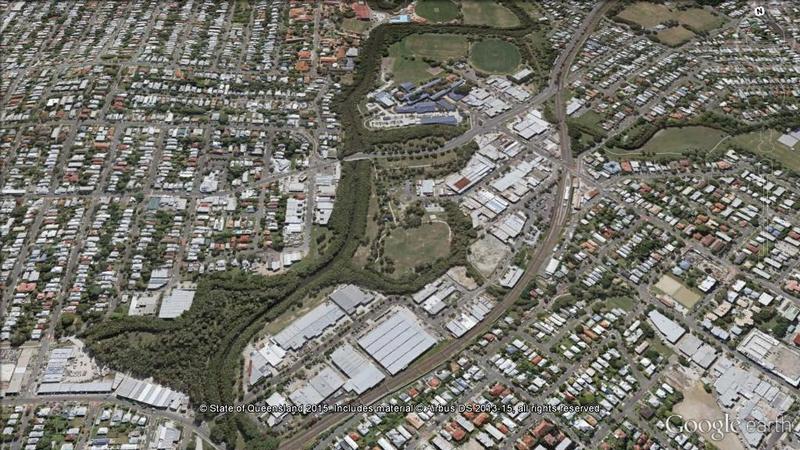
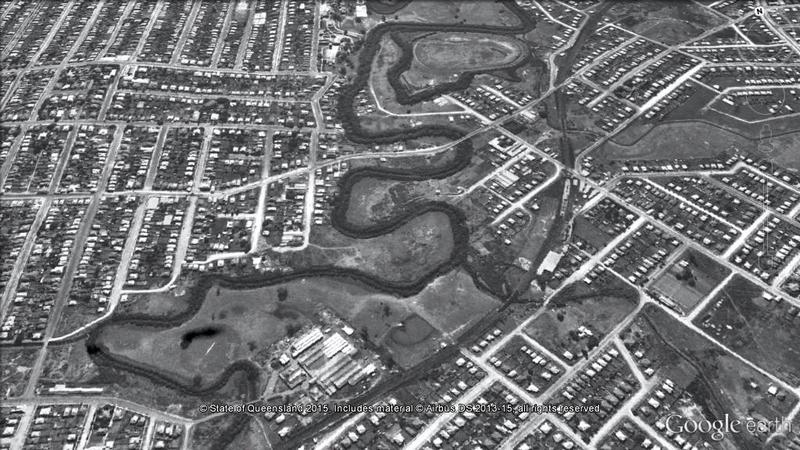
The stretch of Norman Creek between Deshon Street and Stanley Street, Woolloongabba, was straightened during the early 1990s, with several meanders and sharp bends bypassed. Meanwhile, the previously cleared Moorhen Flats has been revegetated.

If you’ve been hanging out for some new content here at oncewasacreek.org, I hope these explorations of Norman Creek provide some satisfaction. I can’t promise any more material in the immediate future, but if you happen to be interested in the intersection between data visualisation and the study of public discourse, you might find more joy at my other blog, seenanotherway.com, which has just lurched back into life and is likely to get a lot more attention in the coming months as I enter the next phase of my PhD.

Brisbane,1946… on Google Earth!

As a certain amply-sized entrepreneur of self-branded cleaning products used to say, “I’m excited!”

I’m excited because I’ve just made a new gallery featuring aerial imagery from 1946 (the earliest of Brisbane, as far as I know) as you’ve never1 seen it before: in Google Earth!

Even better, you can see the difference between then and now just by hovering your cursor over the images — try it on the example below, which shows Norman Buchan Park and the Government House grounds. (If you are using a smartphone or tablet, try tapping the image and then tapping a blank space around it.)


With just the wave of your mouse you can see where the trees have grown, where the bush has been cleared, where the drains have been covered, and much more. All in all, I think this is pretty nifty. Don’t forget to visit the gallery for more images like this one.

One thing these images don’t convey is the experience of actually navigating through 1946 Brisbane in Google Earth. I can tell you that it’s bloody marvellous. And when you see it, you realise that this is where these images belong: on a publicly accessible platform that enables them to be explored from any angle and in conjunction with other spatial information.

But it’s not my business to host these images, and if I did so I would probably be breaching some piece of fine print or another. That is the business of the custodian of this imagery, which I presume is the Brisbane City Council. They have the full dataset already geo-aligned, ready to go. (I, on the other hand, had to stitch together dozens of separate screengrabs from PDOnline, and align them myself using GIS software before converting them into Google Earth’s native format.)

There is a precedent for doing this. The State Government’s Queensland Globe initiative has created a framework that would readily accommodate the 1946 imagery. Queensland Globe (and the open data strategy of which it is a part) is a giant leap in the right direction for making the state’s spatial data publicly accessible. By downloading a single file that opens in Google Earth, you can access various additional layers of information including property and suburb boundaries, land tenure, and an alternative set of aerial images. More layers will — I hope — be added soon.

Queensland Globe would be a natural home for historical aerial imagery such as the 1946 series of Brisbane. Or perhaps the council can create a similar initiative of their own. I don’t really care how it is done. I just hope that before long, you’ll be able to see images like these somewhere other than my humble website.

Notes:

  1. If you have already seen it like this, I want to know where!

Detail Plans on Google Earth

Having recently Google-Earthified several historical maps of the Milton Reach and surrounding suburbs, I thought I’d apply the same technique to some of the City Council’s ‘Detail Plans’. These plans were produced prior to sewerage being installed in Brisbane, and they depict the built environment at a much finer spatial scale than the maps I have used previously. The plans from the Milton and Rosalie areas date primarily from the 1930s, while those further up the Western Creek catchment were made later on, mainly in the 1940s. Each plan covers no more than a few blocks, as in the example below.

Detail Plan no. 771, showing the area between Baroona Road and Elizabeth Street.

Detail Plan no. 771, showing the area between Baroona Road and Elizabeth Street.

These plans show the outline of every house, down to the exact position of its front steps and out-door toilet. They also show things like house names, retaining walls, tram lines, watercourses and drains. Exploring them in Google Earth provides a fascinating way to engage with the history of our built environment.

Rosalie Village as depicted on the City Council's 'Detail Plans' from the 1930s.

Rosalie Village as depicted on the City Council’s ‘Detail Plans’ from the 1930s. The concrete drain is covered except for a small section near Baroona Road. The tram line is also visible.

The complete set for Brisbane contains over 3,000 detail plans. I’ve prepared a sample of just 24 in order to explore the course of Western Creek. The results can be found on this page in the form of a gallery of Google Earth screenshots as well as a link to a file that will enable you to explore the plans directly using Google Earth. If you live in the area, you may be able to find the original outline of your own house, and even the location of the outhouse in the backyard.

Digitised versions of the original plans can be obtained from the Brisbane Images section of the City Council’s library catalogue. They are part of the collection of the Brisbane City Archives. I would particularly like to thank Annabel Lloyd from the Archives for providing me with the plans and answering my many questions about them.

Map Mania!

In several posts and pages now I have used screenshots from Google Earth showing overlays of historical maps, such as the example below.

Red Jacket Swamp (now Gregory Park and Frew Park), as depicted in 1850.

Red Jacket Swamp (now Gregory Park and Frew Park), as depicted in 1850.

I have found this to be a very useful way to both explore and present these maps, and because Google Earth is freely available, I had also hoped that it would provide a way for me to share these maps with anyone else who wants to explore them. However, until now the files that I have created have been clumsy and unreliable, at times crashing Google Earth as soon as they are opened. The files were also large and inconvenient to download.

I have now worked out how to prepare the maps so that they open quickly and smoothly in Google Earth. In addition, I have managed to host the files remotely so that they can be accessed from anywhere without being downloaded in their entirety. Even better, Google now provides a ‘gadget’ for viewing the files within a web browser without even opening Google Earth!

So, I have re-packaged the most interesting maps in my collection and uploaded them so that you can explore them for your enjoyment. They can be accessed from a brand new Maps page in The Study section of the site, but for convenience the links are also listed here:

Preparing these maps so that they display clearly in Google Earth is a bit of a challenge, and to this end I’ve experimented with various colour schemes in addition to the bright yellow that I have used in these latest versions. This scheme is probably not perfect for all of the maps, but hopefully it is adequate for research and ‘exploration’ purposes.

I hope you enjoy exploring the maps. And most of all, I hope they work! Hosting Google Earth data in this way is new territory for me, so I won’t be surprised if some technical glitches occur. Please report any problems that you experience when using them.

And stay tuned… there may be more maps coming in the near future!

Exploring McKellar’s map in Google Earth

The fun with maps continues…

As detailed in last week’s post, I have recently been experimenting with ways of importing historical maps into Google Earth, which enables them to be explored from a whole new perspective. I initially did this for three maps, dating from 1843, 1859 and 1864. Today I’ve done the same for another map — Sheet 7 from a series of maps drawn by the government lithographer A.R. McKellar in 1895. This map shows the Milton Reach of the river and the area to the west up to Mount Coot-tha. You can see what the original version of this map looks like at the Queensland Historical Atlas.

You would already be familiar with this map’s depiction of Western Creek — it is the one shown at the top of this page and all throughout this website. The picture below shows this same part of McKellar’s map in Google Earth. Dunmore Park is in the foreground, and Milton Park, Frew Park and Gregory Park can also be seen along the creek’s path.

Western Creek as depicted on McKellar's 1895 map, viewed in Google Earth.

Western Creek as depicted on McKellar’s 1895 map, viewed in Google Earth.

The image below shows the Toowong Cemetery. Beyond the cemetery, towards the upper right of the picture, is the area bounded by Boundary Road, Simpsons Road and Macgregor Terrace. This subcatchment of Western Creek is marked on McKeller’s map as the Lizzy Lee, Soudan and Rose Hill estates — names that all seem to have been lost, with the exception of Soudan Street. To the left of the cemetery, a ‘school reserve’ is marked on an area that is still bushland today.

The Toowong Cemetery as depicted on McKellar’s 1895 map. Further in the distance are the Lizzy Lee, Soudan and Rose Hill estates.

The Toowong Cemetery as depicted on McKellar’s 1895 map. Further in the distance are the Lizzy Lee, Soudan and Rose Hill estates.

McKellar’s map also depicts part of Ithaca Creek, the catchment of which neighbours the Western Creek catchment. The picture below shows two branches of Ithaca Creek meeting near Carwoola Street. In the immediate foreground, under the name ‘Glenalbro’, you can see the roof of the old Freers chip factory. At the lower-right of the picture is Purtell Park, and right on top of it is the creek as it appears in McKellar’s map. I’ve know this spot for all of my life, but I never realised until now that the path of the creek had been changed to make way for the park.

Part of Ithaca Creek as depicted on McKellar's 1895 map. At the lower-right of the picture, the old path of the creek can be seen over Purtell Park.

Part of Ithaca Creek as depicted on McKellar’s 1895 map. At the lower-right of the picture, the old path of the creek can be seen over Purtell Park.

To explore McKellar’s map for yourself, all you need to do is download either of the following files and open it in Google Earth (you will need to download and install Google Earth first if you haven’t already). The first file shows McKellar’s map features in yellow but without any shadow effect. The second file is the same, but includes the shadow effect that you can see in the images above. The first file is much smaller and will load quicker, but some features on the map will not be as easy to see without the shadow.

Have fun!