It’s reboot time! It’s been eighteen months since I last posted here, and four years since I started my PhD. But my thesis now is nearly out of the way, which means I can return to more recreational forms of writing. It also means I can unveil what I have been working on to keep myself sane during the final stages of my PhD. In case I never fully explained, my PhD was about the application of a computational text analysis technique called topic modelling within social science. Basically, I spent the last four years learning how to do useful things with large amounts of textual data — a practice known as text mining or text analytics. Along the way, I also spent time experimenting with ways of putting textual data on a map. You can see some of the early results in my other blog, which for the last couple of years has been just as neglected as this one.
The methods I explored in my thesis were all based on a dataset of news articles and other texts about coal seam gas development, which has been a touchy topic in recent years in Australia. But I never forgot about my local history blog, and I always hoped to return to it armed with a new bag of tricks. And now here I am, with bag in hand.
Cultural cartography
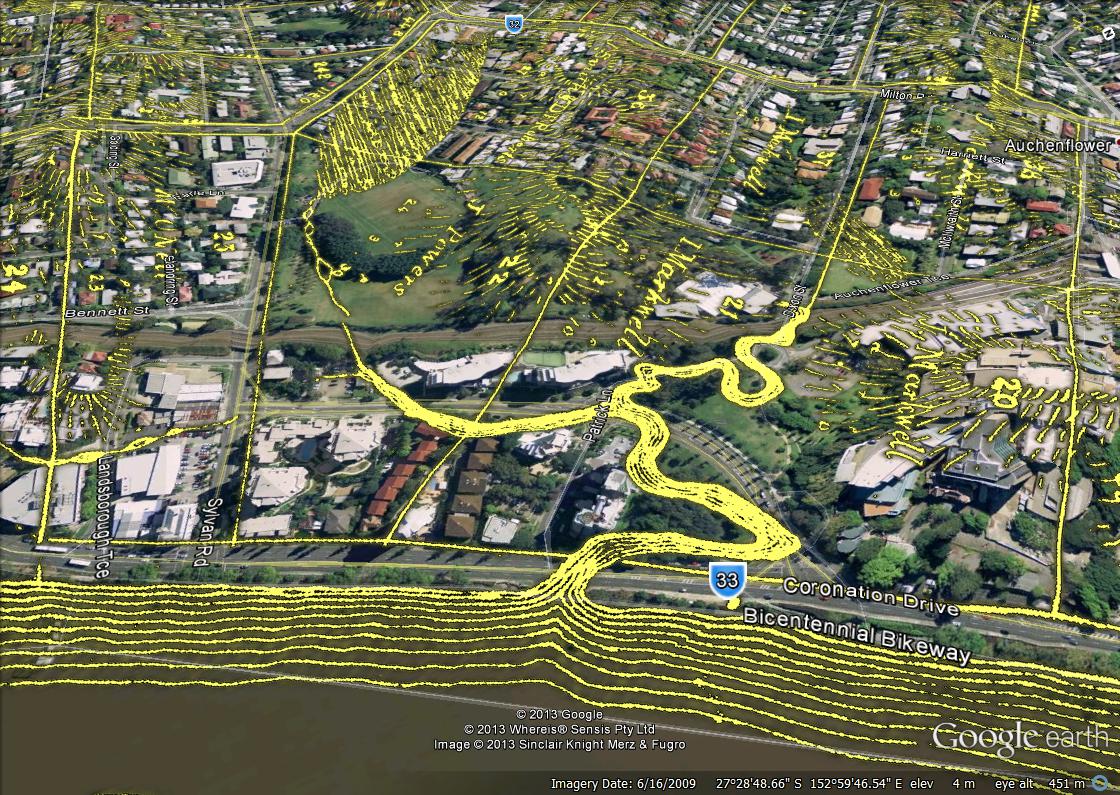
If you’ve spent any time exploring this site, you’ll know that I’m fond of projecting old maps and plans onto the modern landscape as a way of seeing how things have changed. I’ve done this by photoshopping the maps to extract the details and then loading the results into Google Earth, where they can be explored immersively and in three dimensions.

Figure 1. Langsville Creek as depicted in 1859, overlaid on the present-day landscape.
