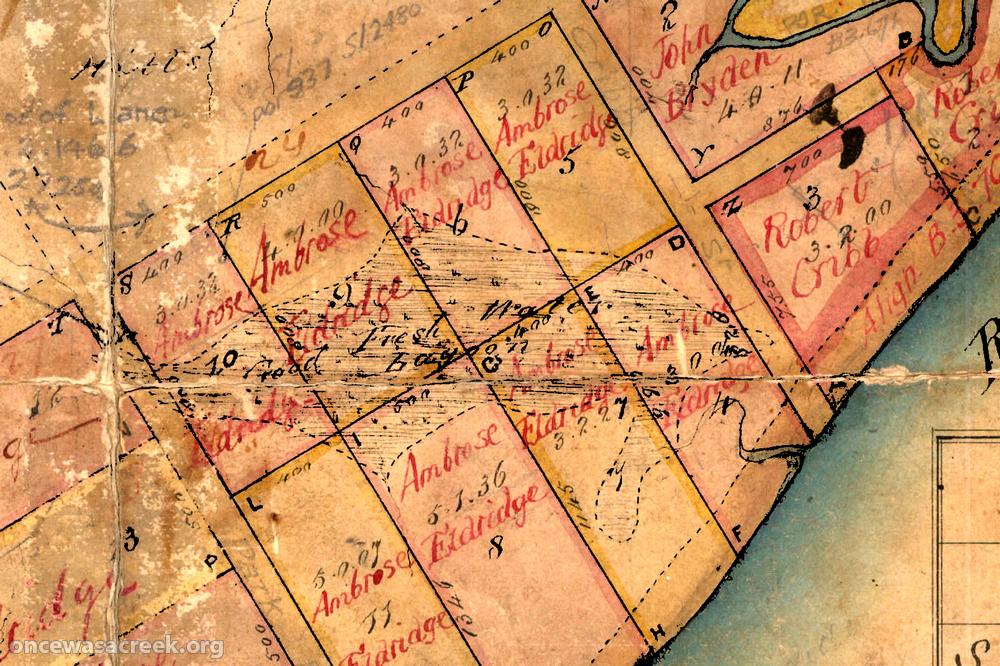
Having recently Google-Earthified several historical maps of the Milton Reach and surrounding suburbs, I thought I’d apply the same technique to some of the City Council’s ‘Detail Plans’. These plans were produced prior to sewerage being installed in Brisbane, and they depict the built environment at a much finer spatial scale than the maps I have used previously. The plans from the Milton and Rosalie areas date primarily from the 1930s, while those further up the Western Creek catchment were made later on, mainly in the 1940s. Each plan covers no more than a few blocks, as in the example below.
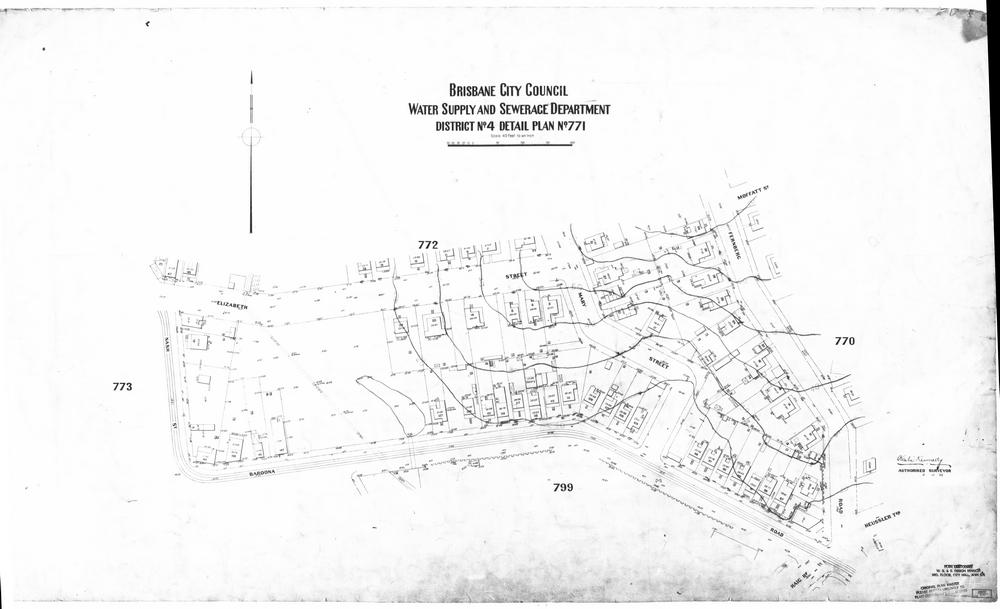
Detail Plan no. 771, showing the area between Baroona Road and Elizabeth Street.
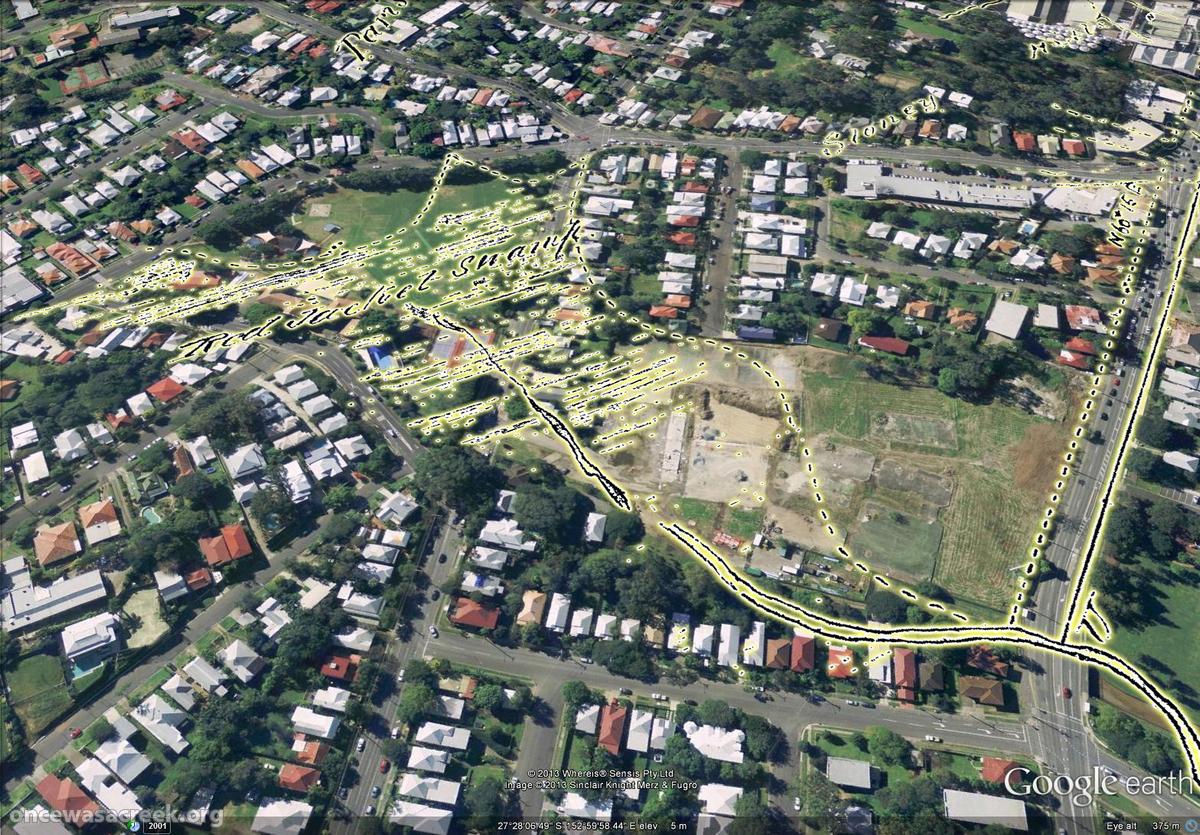
These plans show the outline of every house, down to the exact position of its front steps and out-door toilet. They also show things like house names, retaining walls, tram lines, watercourses and drains. Exploring them in Google Earth provides a fascinating way to engage with the history of our built environment.
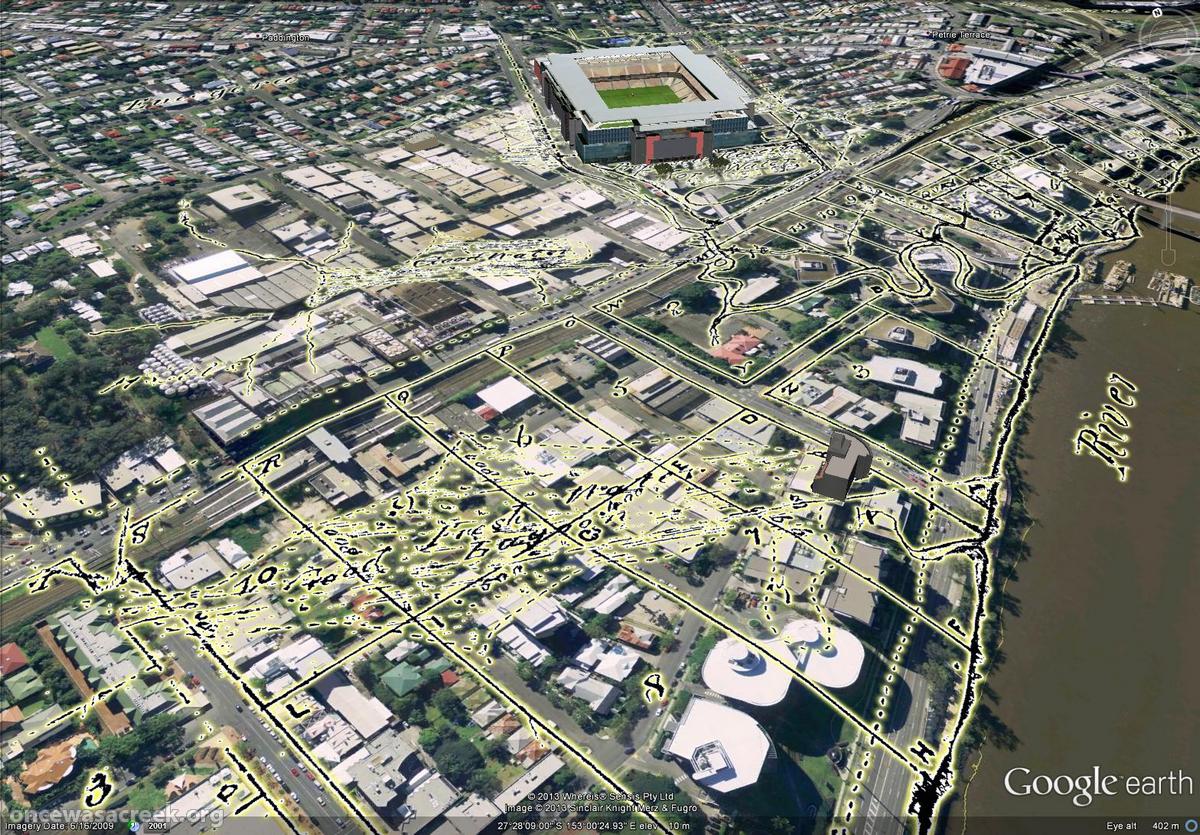
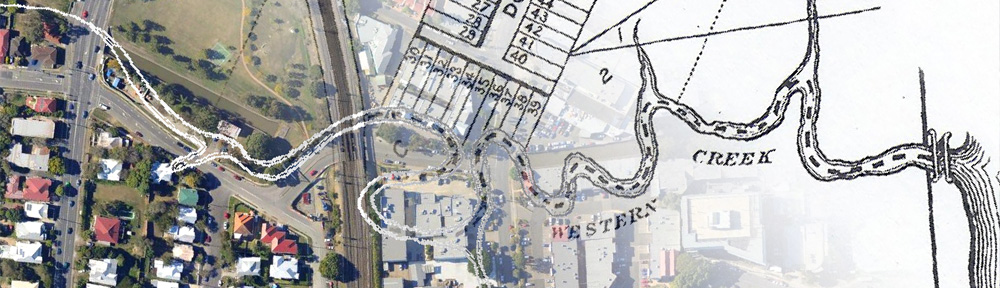
Rosalie Village as depicted on the City Council’s ‘Detail Plans’ from the 1930s. The concrete drain is covered except for a small section near Baroona Road. The tram line is also visible.
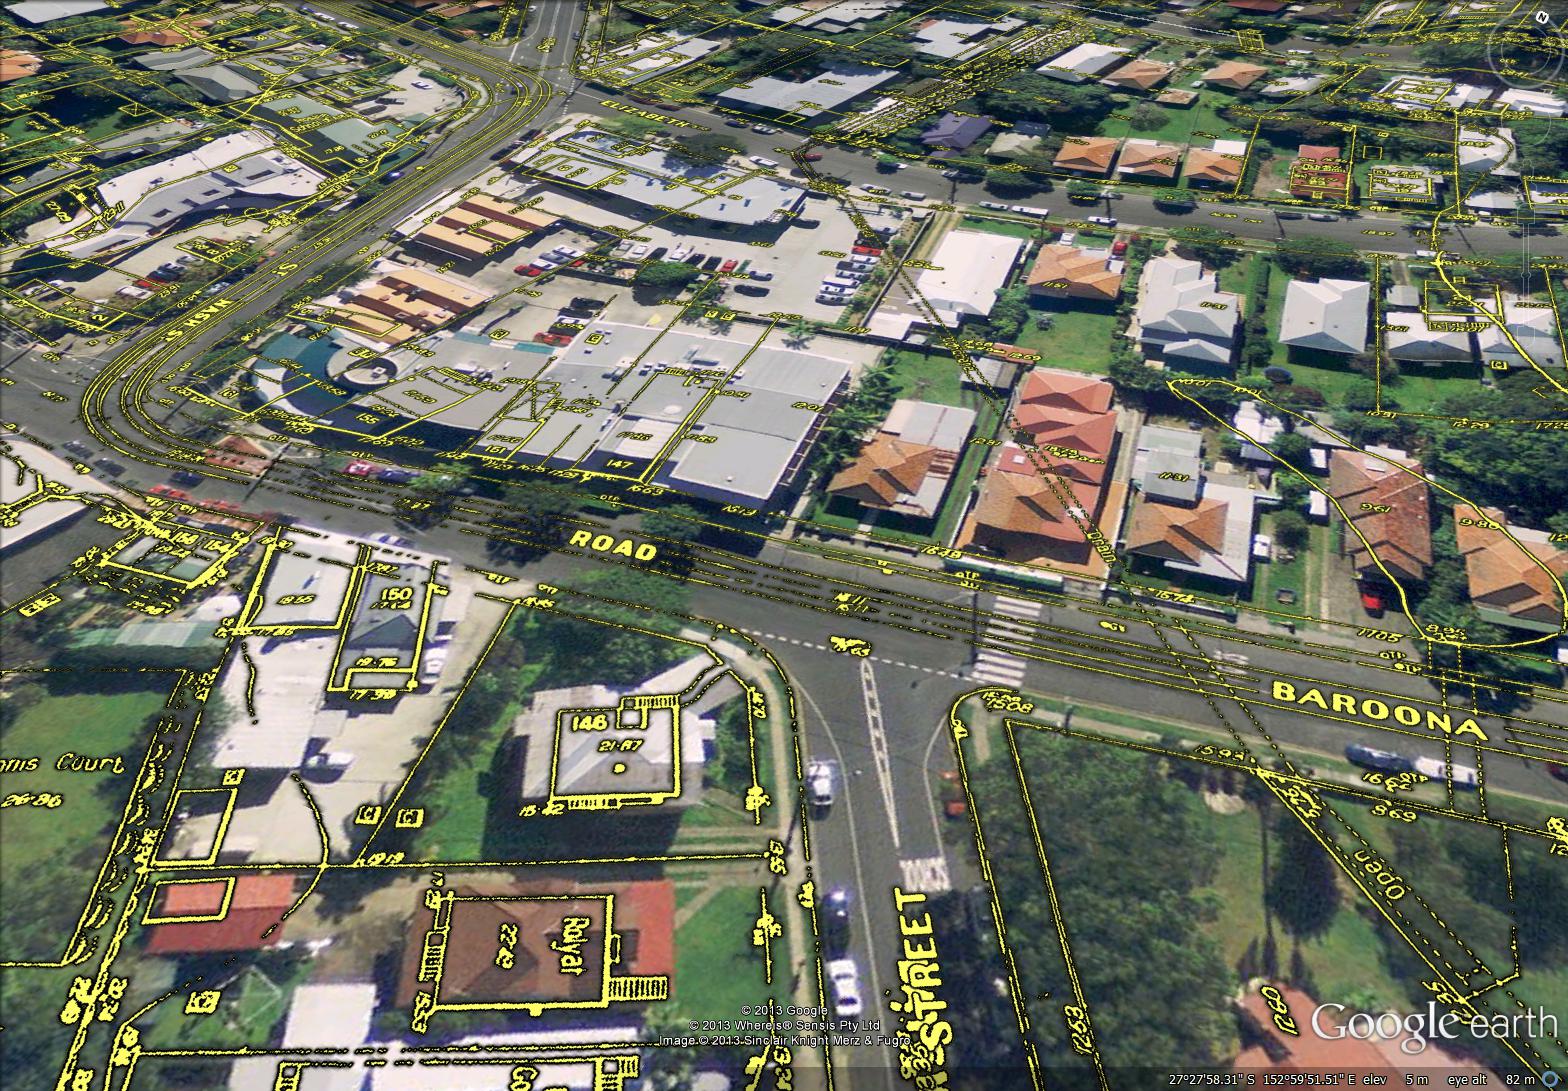
The complete set for Brisbane contains over 3,000 detail plans. I’ve prepared a sample of just 24 in order to explore the course of Western Creek. The results can be found on this page in the form of a gallery of Google Earth screenshots as well as a link to a file that will enable you to explore the plans directly using Google Earth. If you live in the area, you may be able to find the original outline of your own house, and even the location of the outhouse in the backyard.
Digitised versions of the original plans can be obtained from the Brisbane Images section of the City Council’s library catalogue. They are part of the collection of the Brisbane City Archives. I would particularly like to thank Annabel Lloyd from the Archives for providing me with the plans and answering my many questions about them.