Note – many of the pictures in this post contain two images, which flip back forth when you hover your mouse over them. On a mobile device these images will switch when you touch them, and then switch back when you scroll away … if you are lucky. For best results, please view this article on a desktop or laptop.
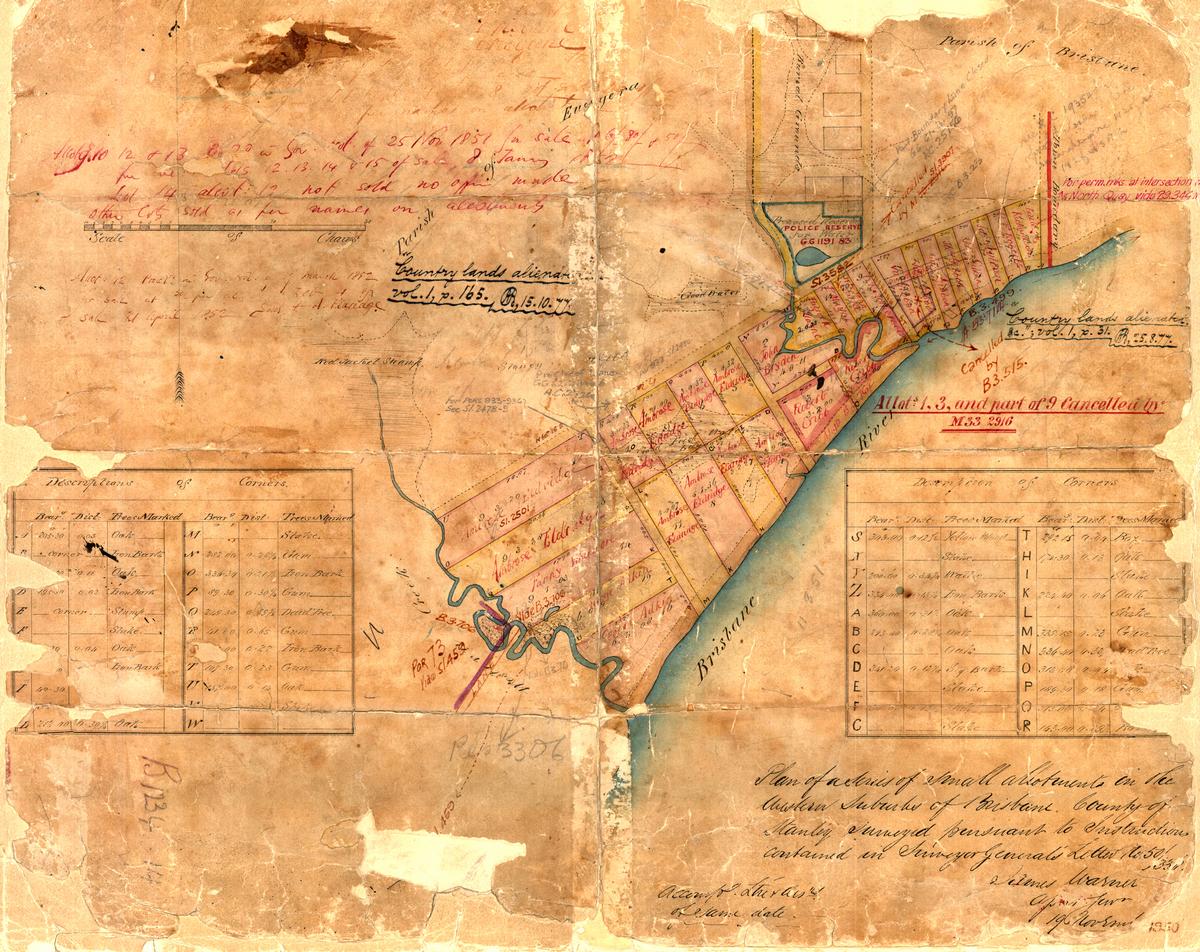
Figure 1. A survey plan of the Milton area in about 1850 (B.1234.14), held by Queensland’s Museum of Lands, Mapping and Surveying.
In an earlier post called The Waters of Milton, I explored a survey plan of Milton drawn in 1850 (Figure 1). Survey plans are valuable historical artifacts because they generally represent the first efforts to capture the landscape on paper. They reveal natural features that have long since vanished, such as creeks, swamps and even hills. They also provide insights into how the colonists saw the land, indicating its potential uses and specifying how it was to be divided up among its new owners.
Since writing that post, I have obtained several more digitised survey plans of the Milton Reach and Western Creek areas, thanks to the assistance of the Museum of Lands, Mapping and Surveying, which is part of the Queensland Department of Natural Resources and Mines. I look forward to featuring them all in articles in the future, but today I will explore just one of them. This particular plan carries the catalogue name of M.31.65. I have no idea what that means, but then there is a lot about these plans that I am still fuzzy about. Some of the surveying markings may as well be hieroglyphs to me, but thankfully there is much that can be gleaned even without specialist knowledge.
Unlike the Milton plan, this one depicts an area inland from the river. I’ll get to the precise area shortly, but first we need to dispense with some formalities.
Meet Plan M.31.65
There are in fact two versions of this plan: the original, drawn in 1862 (Figure 2), and a copy (Figure 2) redrawn some years later (a note on the map suggests 1926, though I’m not sure who would have needed a copy of this plan 64 years after it was first drawn). The original is signed by someone named Bennett — presumably Edward James Bennett, who was Queensland’s chief draftsman from 1860 to 1870. Beneath his signature is the title: “Plan of eleven portions in the Parish of Enoggera, County of Stanley, 1862.” Below that, written in a different hand, is “Country lands alienated, vol. 1, p. 173”, initialed ‘A.B.’ on 19 October 1877 (“alienated land” refers to land appropriated by the Crown). This is the first clue that the plan has been annotated at different times and for different purposes. Indeed, if you cast your eye across the page you can see sketches and scrawlings in at least three different colours, from faded pencil to red marker.
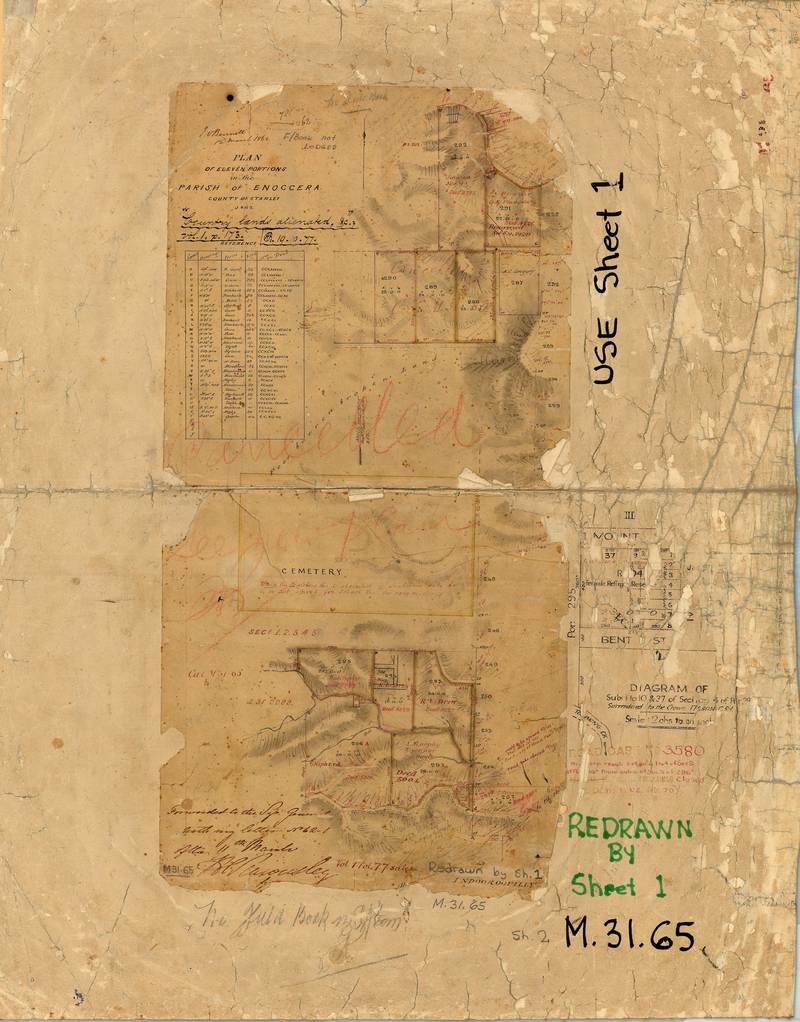
Figure 2. Survey Plan M.31.65 (Sheet 2), held by the Queensland Museum of Lands, Mapping and Surveying.
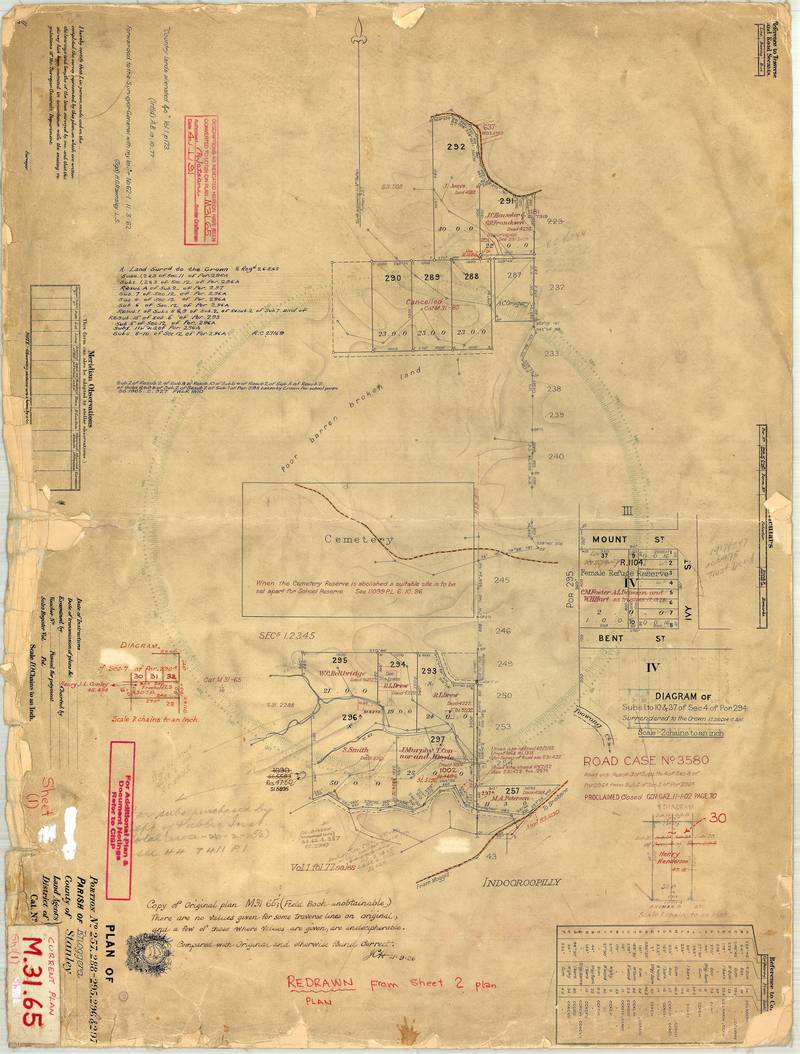
Figure 3. Survey Plan M.31.65 (Sheet 1), a re-drawn copy of the original on Sheet 2.
Continuing down the side of the page, there is next a table listing the corners of each portion of land on the plan (Figure 4). The corners are identified by bearings as well as individual trees on which Roman numerals must have been inscribed. Among the trees are red gums, white gums, ironbarks, bloodwoods and boxes.
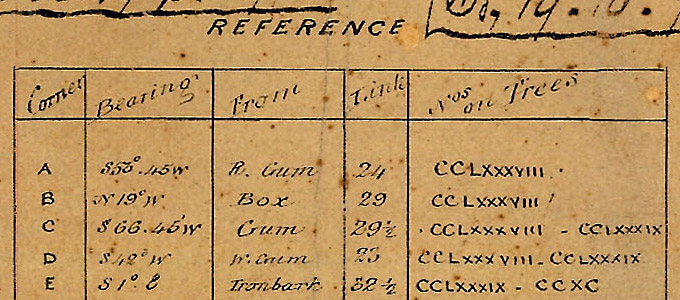
Figure 4. Part of the table listing the corners of the land portions (from Sheet 2).
Several annotations make it clear that the original version of the plan is not the one we should be using. Scrawled across the middle in what looks like red crayon is the word “Cancelled”. Written on backing sheet in thick black marker is the instruction “Use Sheet 1”. So for the remainder of the post, this is exactly what we will do.
The redrawn plan is much clearer than the original but nonetheless seems faithful to it. A handwritten note signed by J.C.H on 29 September 1926 reads:
Copy of original plan M31 65; (Field Book unobtainable.) There are no values given for some traverse lines on original, and a few of those where values are given, are undecipherable. Compared with Original and otherwise found correct.
I don’t know who J.C.H. was, but if the copy was good enough for him (or, less probably, her) then it is good enough for me.
The span of the plan
Enough with the formalities: what does the plan actually show?
If you could stretch the plan to a scale of 1:1 and lay it over the land that it depicts, it would look something like the picture below. It spans from Taringa to Bardon, and includes parts of the catchments of Toowong, Langsville and Western creeks.
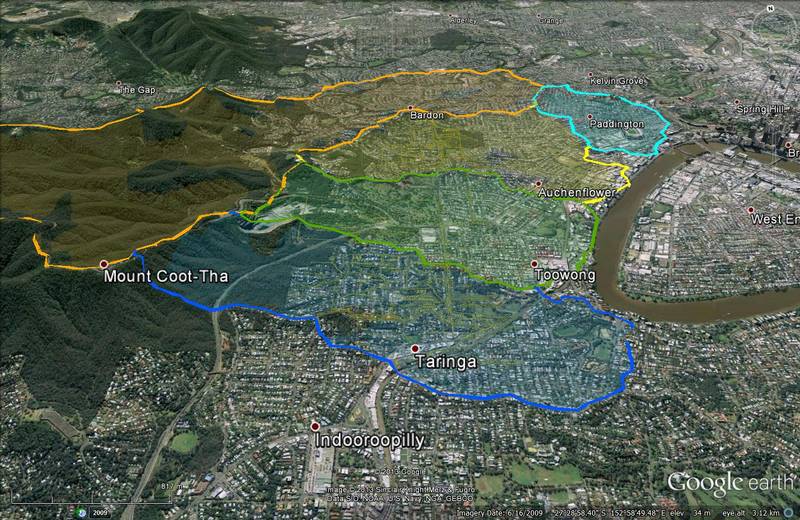
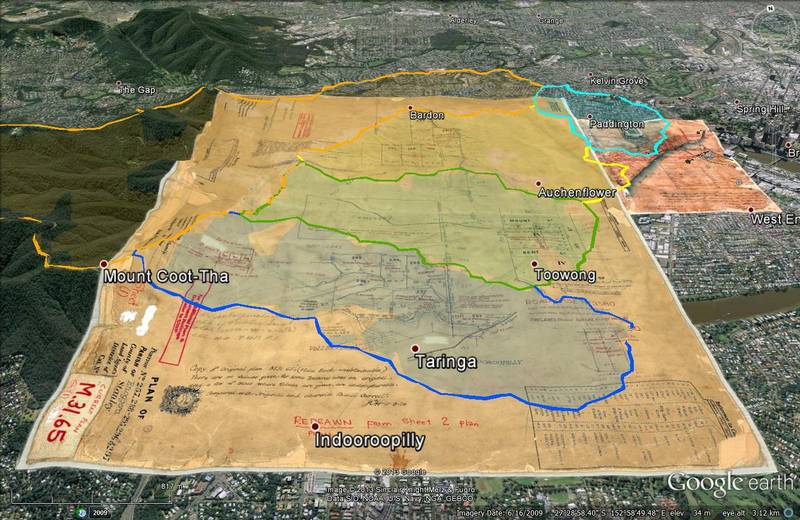
Figure 5. The coverage of Plan M.31.65 — hover over the image to see the landscape beneath. Also shown are the catchment boundaries of Toowong, Langsville, Western, Boundary and Ithaca creeks.
This is a much larger area than that covered by the plan examined in The Waters of Milton (Plan B.1234.14, which is also shown in the image above). However, the plan does not detail everything within this area. Rather, as its title suggests, it focuses on just eleven portions of land. These portions are not contiguous but are instead in two separate clusters at the top and bottom of the page. Also on the page are three smaller ‘diagrams’ which show specific streets and subdivisions in more detail.
The eleven land portions on this plan comprise just a small slither of the whole Parish of Enoggera, which covered all of the area between the CBD and the western extremity of the Enoggera Creek catchment in the D’Aguilar Range. To the north of the Parish of Enoggera were the parishes of Samford, Bunya and Kedron, the latter two lying on the other side of Kedron Brook. To the east, beginning with the suburbs of Hamilton, Ascot and Clayfield, was the Parish of Toombul. To the south, at the western end, was the Parish of Indooroopilly, which was separated from the Parish of Enoggera by the Taylor Range and Toowong Creek. The Milton Reach of the river formed the remainder of the southern boundary up to Boundary Creek in Milton. East of here, and extending as far north as Enoggera Creek, was the Parish of North Brisbane.1
The first portions to be surveyed in the Parish of Enoggera were those situated along the Milton Reach in the suburbs of Milton, Auchenflower and Toowong. These were surveyed progressively during the 1850s but appear collectively on the Plan of Portions 203 to 257, drawn in 1859. Plan M.31.65, drawn three years later, covers the area immediately to the west of the 1859 plan.
Now, let’s meet the land portions on Plan M.31.65.
The rectangles of Rainworth
The portions at the top of the plan (Figure 6) are centred around the locality known today as Rainworth (named after the house of Sir Augustus Charles Gregory, Queensland’s Surveyor General from 1859 to 1875). Portion 291 is the western half of the Government House property, once occupied by the German immigrant and businessman Johann Christian Heussler. The path that forms the top edge of this portion is today still the Governor’s driveway. At the top of Portion 292 this path aligns with modern-day Macgregor Terrace.
To the south, Portion 287 overlies much of what is now Norman Buchan Park as well as the adjacent residential blocks. A.C. Gregory held this portion along with Portion 232 immediately to the east, where he built Rainworth House. In the foreground of the picture, right beneath the word ‘Cancelled’, is the playing field of Rainworth State School. The three rectangular portions in this area (288-290) are each exactly 10 chains wide and 23 chains long, thus covering an area of 23 acres each. (A chain is 22 yards, or 20.12m — the same length as a cricket pitch. The measurements on the plan are in links, one hundred of which make a chain.) Like the portions around them, they are aligned exactly with the north arrow on the plan (which itself is labelled “North according to McPatten”).
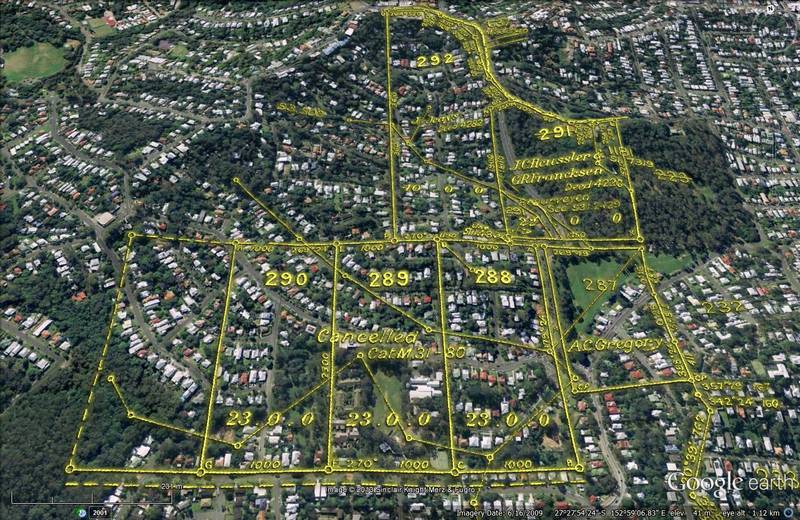
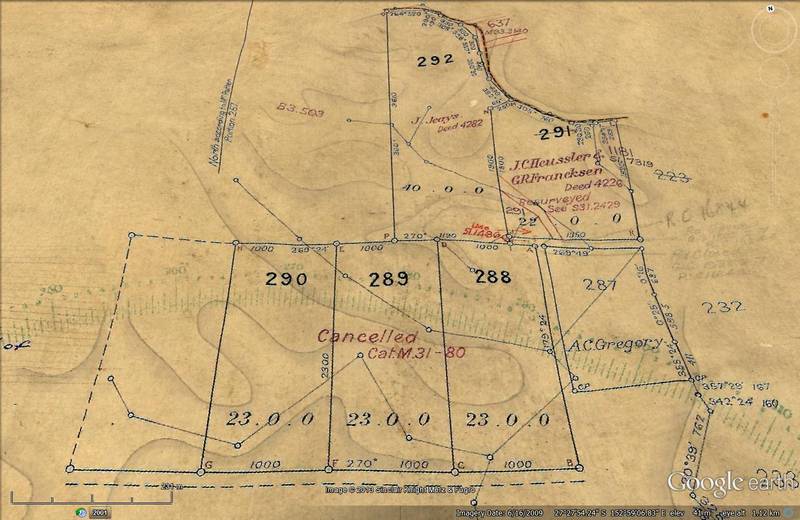
Figure 6. The land portions at the northern end of Plan M.31.65. Hover your mouse over the image to see the landscape underneath. In the upper-right part of the picture is the Governor’s residence, while in the middle foreground is the playing field of Rainworth Primary School.
Zig-zagging through all of the land portions is a network of line segments joined by small circles. These represent the lowest points of the landscape (or in some cases, the highest). In all likelihood, this is the earliest tracing ever made of Western Creek.
These wireframe watercourses, the hills that surround them (which you might have mistaken for watermarks), and the governor’s driveway, are about the only things on this part of the plan that relate to the modern landscape. Unlike on the plan from the Waters of Milton, very few of the land portions on this part of Plan M.31.65 align with today’s roads or property boundaries. The reason, I suspect, is that the rectangular plots, while allowing for a perfectly equal allocation of land, make no allowance for natural boundaries such as ridges and waterways. Such natural features are of little consequence if all that is being put on the land is fenceposts and farmhouses, but roads are another matter. Roads are best built along ridges and watercourses, as these provide the gentlest possible gradients. In hilly country, the most efficient route from A to B is not necessarily a straight line.
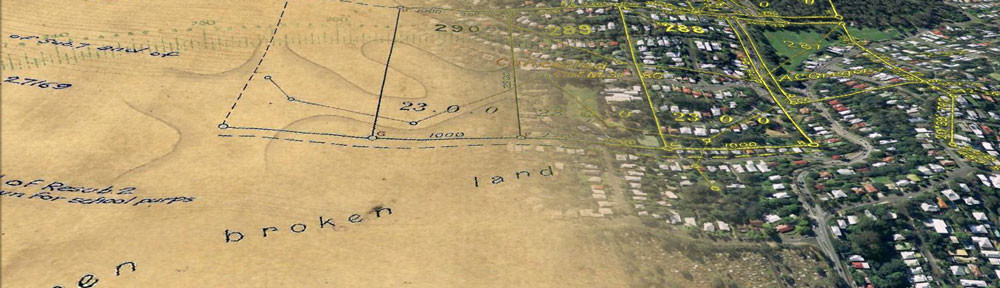
I don’t know why or when the three rectangular portions on this part of the plan were cancelled, but I’d be willing to bet that it was because someone sketched out the preferred path for a road, and realised that it would run straight through all of them. A parish map dating from around 1900 (Figure 7) shows that these portions were indeed split up to accommodate Boundary Road.2
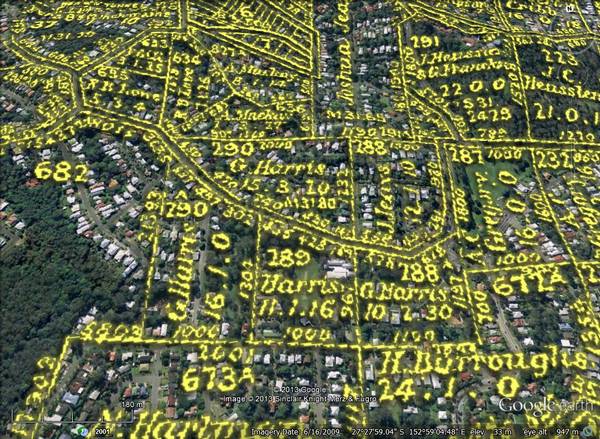
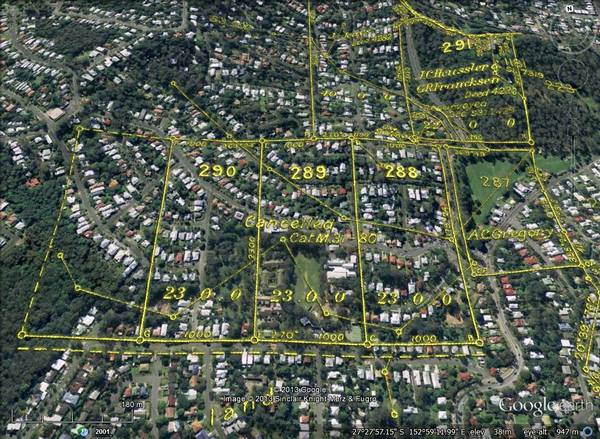
Figure 7. Portions 288-290 were split up to accommodate Boundary Road, which presumably had not been formed when the 1862 plan was drawn. Hovering over the image will reveal the divided portions as depicted on a parish map dating from around 1900.
Today, the geometry of the streets in this area (and in much of Brisbane) echoes the contours of the land. Along the ridges run major roads like Boundary Road and Simpsons Road, while smaller roads such as Warburton and Runic streets run through the valleys. Streets that connect up the ridges and valleys (such as Brown Street and Selby Street) tend to run perpendicular to the two, tackling the slopes head-on. Such streets are necessarily steep, but they have the advantage of being level from one edge to the other without the hillside needing to be excavated.
The trapezoids of Toowong
We jump now to the bottom of the plan, where there are six portions of land in what we would now call western Toowong (Figure 8). They differ from the rectangles of Rainworth in that they are all irregularly shaped. There are some straight sides among them, but at best the portions could be described as trapezoidal, and some of them are too complicated to be called even that.
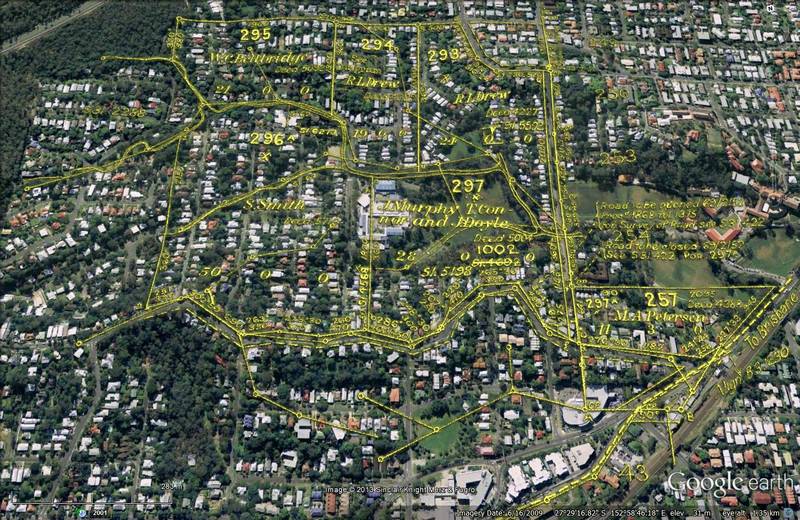
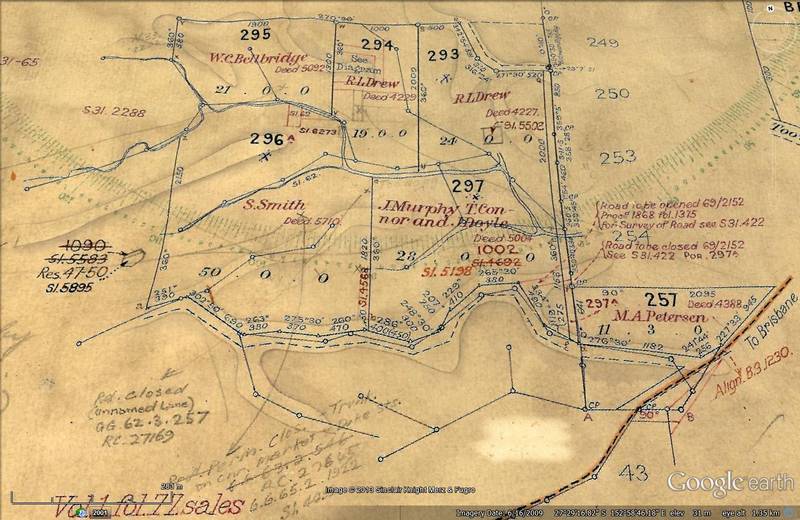
Figure 8. The southern end of Plan M.31.65, showing six portions in western Toowong. Hovering your mouse over the image will reveal the modern landscape, including Toowong High School (centre), Brisbane Boy’s College (right), and the Taringa shopping/medical centre (bottom).
Portions 296 and 297 are bounded to the south by the ridge that Stanley Terrace follows today. The plan suggests that there was a road here even in 1862, and that it determined the southern boundary of these portions. At the eastern edge of the plan, that road joins what is now Moggill Road, which similarly constrains Portion 257. Interestingly though, Portion 257 was larger on the 1859 Plan of Portions 203 to 257. On that plan (shown in Figure 9), the road that became Stanley Terrace is absent, allowing the portion to fill out a more regular trapezoid (Moggill Road still prevented it from being a rectangle).
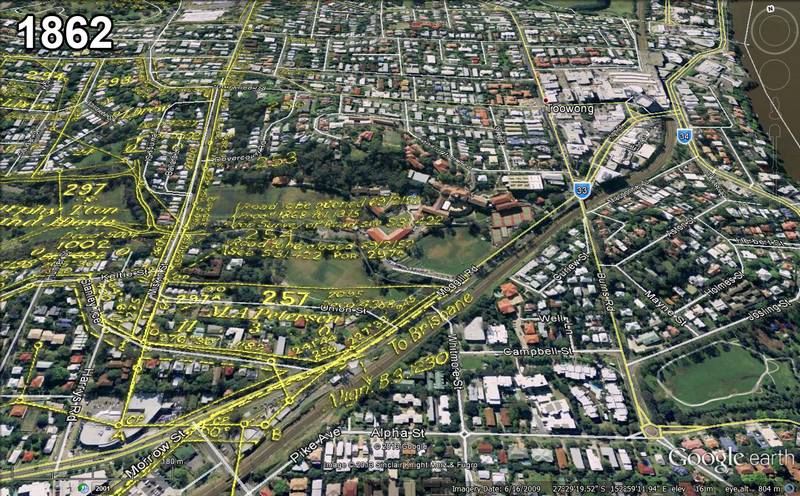
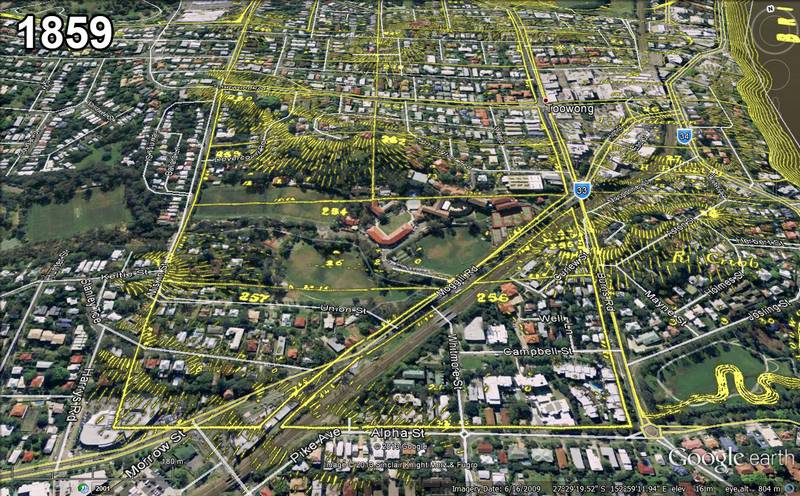
Figure 9. Portions depicted on a plan from 1859 and (when you hover over the image) the 1862 plan. Notice how Portion 257 gets truncated in the 1862 plan by Stanley Terrace.
Making sense of of Miskin Street
Running along the eastern edge of Portions 293 and 297 in Figure 8 is a long, straight road. This road aligns with modern-day Miskin Street, but with some notable differences. On the 1862 plan, the southern end of the road continues in a straight line all the way through to Stanley Terrace. Today, this part of Miskin Street does not exist. Instead, Miskin Street connects to Moggill Road via Union Street and to Stanley Terrace via Keltie Street. The closing of Miskin Street and the opening of Keltie Street are marked with annotations (possibly dating from 1869) on the 1862 plan, shown below in Figure 10.
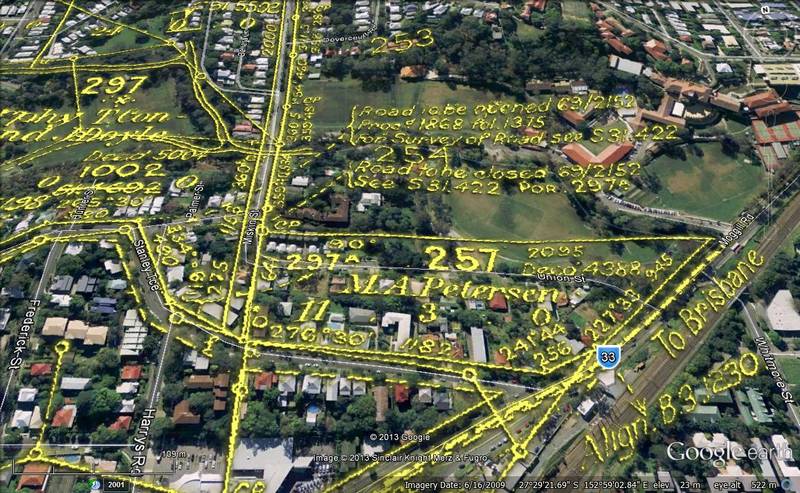
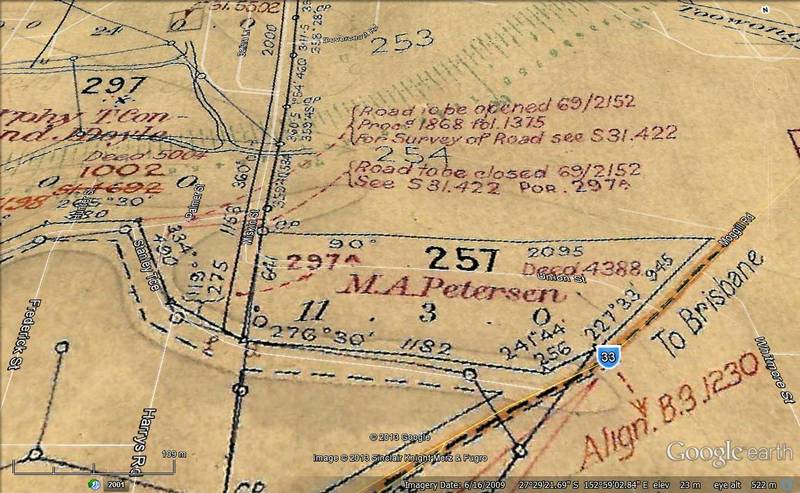
Figure 10. Annotations on Plan M.31.65 referring to the closing of the southern end of Miskin Street and the opening of Keltie Street. Hovering over the image reveals that the southern tip of Miskin Street is now a residential block, and that Keltie Street (not labelled) connects Miskin Street to Stanley Terrace.
On the 1862 plan (Figure 8), the northern end of Miskin Street terminates at the top of Sherwood Road. Miskin also terminates here today, but it resumes its path a short distance later at Woodstock Road before continuing all the way to the Toowong Roundabout, where Frederick Street continues along the same path past the Toowong Cemetery. For a time, however, Miskin Street was open between Sherwood Road and Woodstock Road. You can see this clearly on McKellar’s 1895 map (shown below) and also in the 1946 aerial imagery of Brisbane (viewable at the Brisbane City Council’s PDOnline).
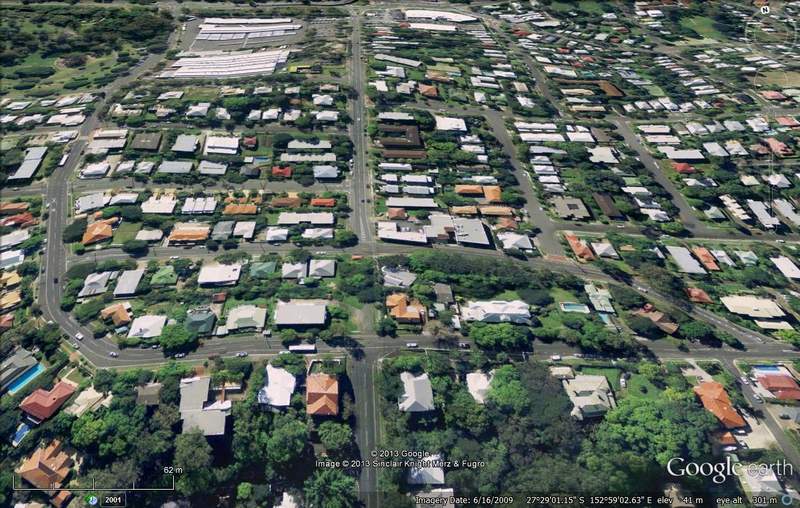
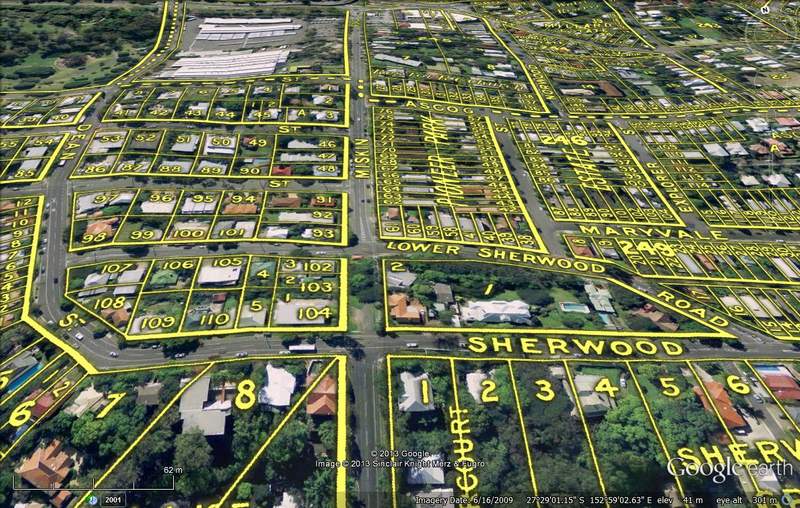
Figure 11. Today, Miskin Street is closed between Sherwood Road and Woodstock Road (once called Lower Sherwood Road), but once upon a time this section was open, as shown above by the details from McKellar’s 1895 map. (The original map is available from the Queensland State Archives, Item ID 618814.)
My guess is that both of these modifications to Miskin Street were concessions to the topography. The direct route to Stanley Terrace at the southern end ran down one steep slope and up another, whereas the route via Keltie Street follows a gentle ridge. At the northern end, the steep descent from Sherwood Road to Woodstock Road presented unnecessary risks when there were alternative routes along Dean Street and Sherwood Road.
Even with its steepest parts removed, Miskin Street remains something of a roller-coaster ride. I can still remember getting excited as a kid whenever my parents drove down this street. The steep descent down either side was just the appetiser. The real thrill came from the sharp rise at the bottom which hurled the car (and your stomach) upwards just as terminal velocity was about to be reached. Then as the rise fell away again you wondered if the car might actually take off, before another sudden jolt signaled the beginning of the climb up the other side. The experience wasn’t always pleasurable. One night on the journey home after I had gorged myself silly at Sizzler’s, I remember being told — or rather challenged — to hold onto my stomach when we hit the hump at the bottom.
Amid the excitement, I never thought to wonder why Miskin Street took this particular route. Its distinctive double-dip was just a fact of life. Now as I reflect on it, I have to concede that in all likelihood the street was not designed for the pleasure of thrill-seeking children. For a start, its ups and downs would not have been much fun for a horse and cart, which is all that anyone would have been driving when the street was built. So why does it take the path that it does?
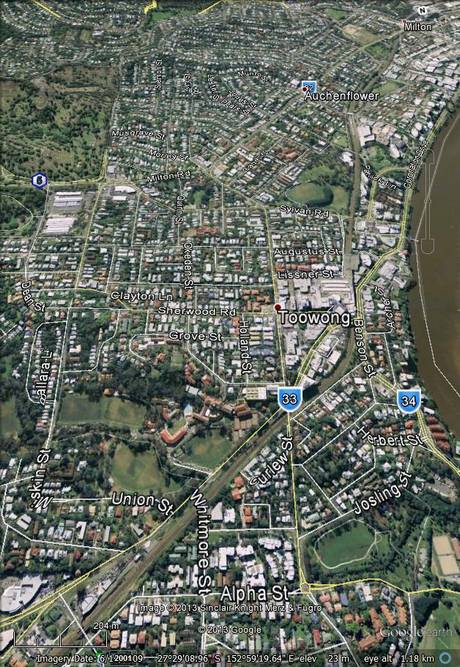
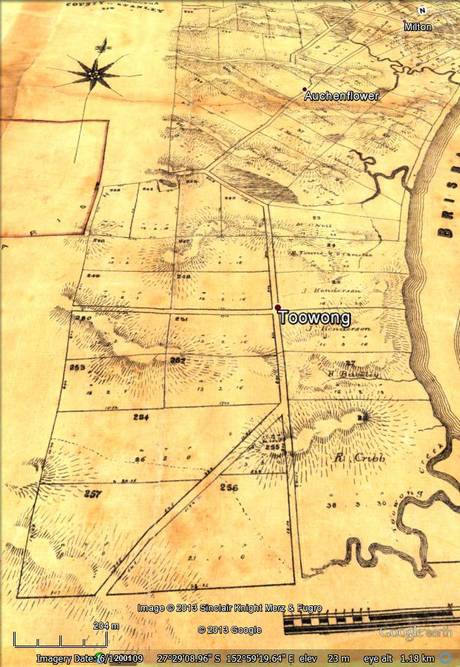
Figure 12. Part of the Plan of Portions 203 to 257, dating from 1859, showing the portions that form the eastern side of Miskin Street and part of Frederick Street. The modern streets can be seen by hovering your cursor over the image.
One thing that Miskin Street did not follow is the local topography. If it had, it would not have run in a straight line. Taken together, Miskin and Frederick streets form one of the longest straight roads in this part of Brisbane.
The alignment of this long, straight road is not arbitrary. Throughout Brisbane you will find roads sharing exactly the same orientation, from Mains Road at Sunnybank to Webster Road at Chermside. In fact, every second street in Melbourne (and in many other cities as well) runs in nearly the same direction: just a few degrees from true north, but aligned with magnetic north at the time and place of the original survey. You can see in Figure 12 that Miskin Street (like Jephson Street) aligns exactly with the north arrow on the 1859 plan, just like the rectangles of Rainworth did on the 1862 plan.
Why align roads to the arms of the compass? I suspect it is a matter of convenience and aesthetics more than anything else. No doubt it warms the heart of every draftsman and surveyor to see the world brought into line with the north arrow. Whole cities are designed this way where the terrain allows it, Melbourne being a good example. But Brisbane’s layout is constrained by its river, creeks and hills, so that only a smattering of neighbourhoods remain faithful to the compass. My reading of the plan in Figure 12 is that Miskin Street, and the land portions that define it, qualified for the default north-south alignment because the adjoining part of the river runs in roughly the same direction. Immediately to the north, the river heads in a different direction, and so the adjacent land portions are rotated.
With its alignment accounted for, we should now ask why Miskin Street is placed where it is, rather than some distance to the east or west. The question that that we are really asking is why the land portions on the eastern side of Miskin Street are the size that they are. I can only come up with one explanation: that the cemetery reserve — the large rectangle that is partly visible at the top-left of Figure 12 — was put on the map before the land portions.
I’ve reached this (very speculative) conclusion because the portions between Jephson Street and Miskin Street are not of a standard size — according to the measurements on plan, the distance between the two streets is exactly 32.64 chains — yet there seems to be nothing except the cemetery reserve to constrain them. While the reserve itself appears to be floating arbitrarily in space, the distance (measured in Google Earth) from its south-eastern corner to the corner of the River Road (now Coronation Drive) is just a shade under 60 chains (1,207m) — a figure that seems a bit too round to be an accident (although I admit that it could be just that).
In other words, if not for the cemetery and the north pole, Miskin Street might not have been so much fun.
A dividing line
As Figure 9 shows, Miskin Street is essentially the dividing line between the 1859 plan and the 1862 plan. It’s a divide of only one chain (the standard width of a road) and three years, yet the land portions on either side of the road look very different from one another. The portions in the 1859 plan (see Figure 9 or Figure 12) are all perfect rectangles (except where dissected by Moggill Road), while the portions in the 1862 plan are all irregularly shaped.
As noted earlier, Portions 296 and 297 have a wavy southern boundary on account of Stanley Terrace, which runs along a ridge. To the north these portions are bounded by another natural feature: Toowong Creek (see Figure 8). The creek is also the southern boundary of Portions 293, 294 and 295, and part of the western boundary of Portions 295 and 296. The interesting thing is that Toowong Creek also flows through two of the portions on the 1859 plan, but without influencing their size or shape. The creek is visible on the 1859 plan as a dotted line passing through Portions 254 and 256 (see Figure 12).3 On the other side of Jephson Street the creek is drawn much more boldly, possibly indicating the limit of backflow from the river.
Why was Toowong Creek used as a boundary in the 1862 plan but not in the neighbouring plan of 1859?4 The plans cover two contiguous portions of the creek, so it is hard to imagine that there were any significant physical differences in the size or depth of the stream. Could the approach to defining land portions in Brisbane have evolved between 1859 and 1862, so that waterways and other natural boundaries were more likely to be used? Or did such practices simply differ from one surveyor to another? I’m out of my depth trying to answer this question, but I will keep my eye out for any patterns that emerge as I examine more plans.
To wrap up the discussion of the Western Toowong portions, I’ll note that the northern-most boundary of Portions 293 to 295 aligns with modern-day Elizabeth Street. Like Miskin Street, this is another straight line that has become embedded in the built environment. It is broken, though, by Portion 293, which has a corner cut out to accommodate the bend in the top of Dean Street — another road that (more or less) follows a ridge instead of a fenceline.
Reserved for a reserve
A little to the north of the Western Toowong portions is the cemetery reserve that I mentioned earlier in connection with Miskin Street. On the 1862 plan (shown below in Figure 13) it is labelled ‘Cemetery’ but contains the comment “When the cemetery reserve is abolished a suitable site is to be set apart for School Reserve”. Running through the reserve is a track which aligns more or less with Mount Coot-tha Road on the eastern side, and with the tip of Old Mount Coot-tha Road to the north-west. Otherwise the track runs parallel with the modern Mount Coot-tha Road, straight through what is now the main lagoon at the Botanical Gardens, and what would have once been a watercourse of Langsville Creek.
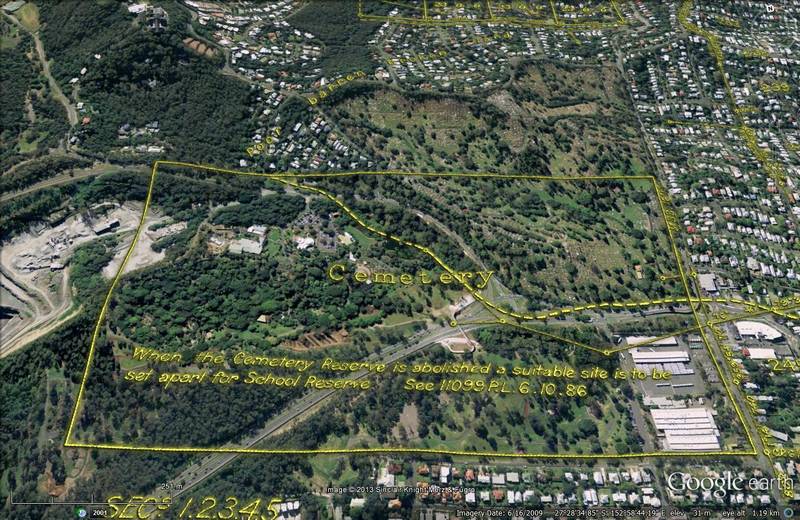
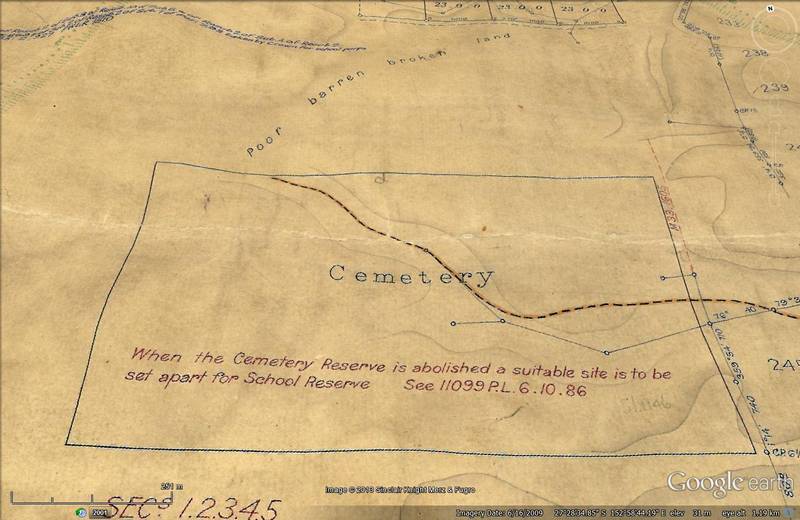
Figure 13. The cemetery reserve on Plan M.31.65. Hovering over the image will reveal that the reserve only partly overlaps with the Toowoong Cemetery.
If you hover your mouse over Figure 13, you’ll notice that the Cemetery Reserve overlaps only partially with the Toowong Cemetery. The rest of it is occupied by the Mount Coot-tha Gardens, Anzac Park and the bus depot. If you are getting the impression that the history of the Toowong Cemetery might be less than straightforward, then you are spot on. As the description of the cemetery on the Queensland Heritage Register explains,
Bureaucratic procrastination, manoeuvring and public discontent colour the early history of the Brisbane General Cemetery at Toowong and contributed to the decades of delay in providing a new General Cemetery for Brisbane in the second half of the nineteenth century.
The reserve marked in this plan is the 200 acres that were set aside for a cemetery in 1861 (at least that’s what the Heritage Register says; I suspect that the land was identified earlier, given that the reserve appears on the 1859 plan). A further 53 acres were added in 1868, bringing the eastern half of the reserve all the way up to Birdwood Terrace. In 1870 a panel of highly distinguished trustees was appointed, including the mayor (William Pettigrew), three ex-mayors (John Petrie, John Hardgrave and George Edmondstone), and a future premier (Samuel Walker Griffith). Deeming the site and its rocky ground to be unsuitable for a cemetery, they sought an alternative site but failed to secure one. They even kept looking after the site had received its first burial — that of Queensland’s second governor, Samuel Wensley Blackall, who had been a strong supporter of the site — in January 1871. Soon afterwards though, the trustees must have acquiesced to keeping the site. Fifty-three acres of land were cleared in 1872 (the modern site covers about 100 acres), and the cemetery officially opened in July 1875.
The remainder of the original reserve, or part thereof, was leased to the Defence Force in 1886 for use as a rifle range. In 1915 it was purchased by the Toowong Town Council and became Anzac Park. As far as I know, no part of the original cemetery reserve ever became a school reserve, despite the comment to that effect on the 1862 plan. A school reserve was, however, declared on Portion 870, which was just to the north of the cemetery reserve, between Mount Coot-tha Road and Birdwood Terrace. But no school was ever built there either. To this day, the whole portion remains undeveloped.
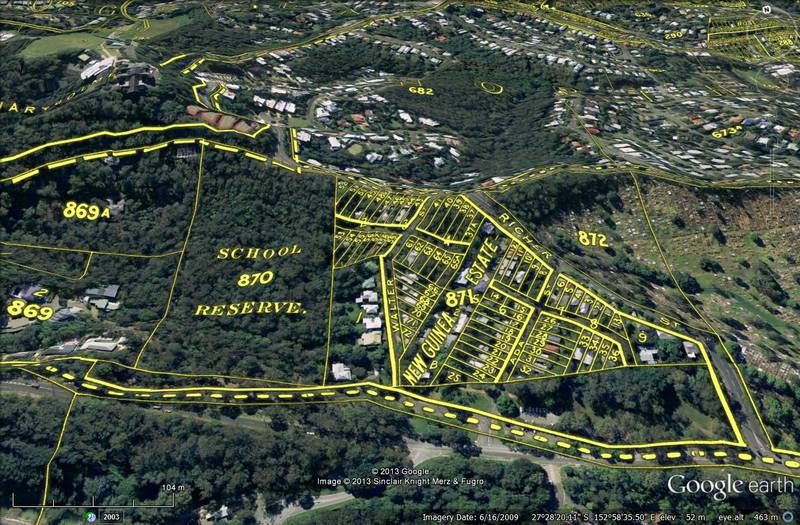
Figure 14. Details from McKellar’s map of Brisbane (1895), showing the school reserve between Birdwood Terrace and Mount-Coot-tha Road.
Abandon all hope, ye who garden here
Between the cemetery reserve and the rectangles of Rainworth, there is nothing on the survey plan except four words stretched across empty space:
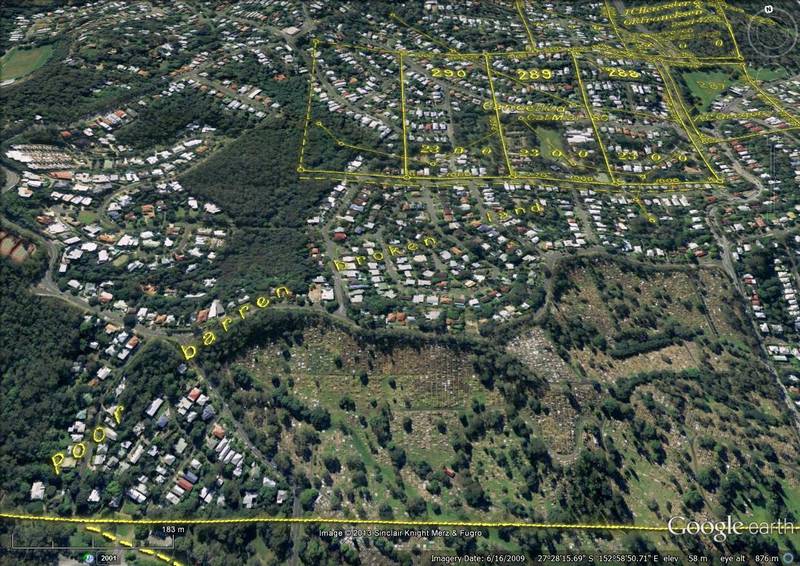
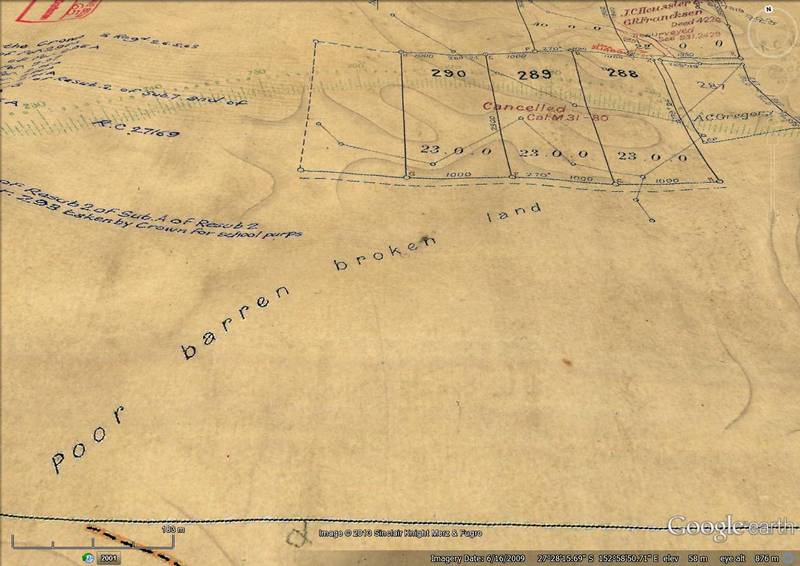
Figure 15. The empty area in the middle of Plan M.31.65. This area corresponds with the slopes on either side of Birdwood Terrace near the Toowong Cemetery.
Poor barren broken land. You’d think that the words were describing a stretch of desert, some sort of rocky, treacherous terrain populated only by the occasional kangaroo skull and watched over by circling crows. They in fact refer to the land on either side of Birdwood Terrace, from the slopes of the Toowong Cemetery to the houses along Main Avenue. At the western extremity of this area are the bush reserves around Tristania Drive (abutting the Stuartholme Estate) and Walter Street (opposite the Mount Coot-tha Gardens). These reserves provide some idea of what this land must have been like when it was first surveyed. They are by no means lush and bountiful forests, but nor are they what I would call barren or broken (whatever that means).
To understand the surveyor’s harsh assessment, we need to imagine the landscape through his eyes, and through those of his employers. The government of the day needed to know what could be done with the land — what it could be used for. And on this account, the surveyor made one point perfectly clear: do not waste your time trying to grow anything in these hills. It was a fair warning. As any gardener in these hilly parts of Bardon and Toowong will know, the soil is dry, rocky and full of clay. If you aspire to grow anything except native scrub or a few stubborn weeds, you are best advised to import your soil from Bunnings. When your tomatoes fail even then, take solace in knowing just how big a challenge you have taken on. Remember that the wise men of the Toowong Cemetery Trust declared these hills unfit for digging graves, let alone gardens. But when your roses finally bloom, bask with pride in the glory of your little victory over history; for you have breathed life into the poor barren broken land.
More than the roses
When I started exploring Plan M.31.65, I never expected it to invoke such personal memories as the tummy-wrenching ride down Miskin Street or my mother’s tireless efforts to make things grow in the barren slopes of Bardon. But I shouldn’t be surprised that it has. By its very design, the plan contains both the essence of the natural landscape and the blueprint of the built environment — the very hills and streets in which I grew up. It captures these things in ways that few other documents could, depicting and describing features that no map-makers or writers have been compelled to since, and revealing the modern street map in its barest ancestral form. It is a snapshot of a suburb being born.
The plan also shows that the birth of a suburb can be messy, littered with alterations, cancellations and false starts. Boundaries are redrawn, roads opened and closed, and reserves relocated. Through it all, we learn (and then occasionally forget) how to live and build on a challenging landscape.
Plans like these are humble but crucial pieces of our history. They may not hold the keys to our national character or bear the names of our national heroes, but they are fundamental to the story of our everyday lives and surroundings. Without them, we can never really understand how our suburban environment came to be.
So what?, you might say. We can live in our surroundings perfectly well without knowing or even caring how they got there. But then we are just passing through, even if we are stopping to smell the roses. As I hope this post has shown, there is much to be gained from knowing our environment on more intimate terms. Our experience of it becomes richer, and our appreciation greater. New insights and questions spring from even the most familiar of streets and barren of hills.
In the end, we can never escape our environment, so we might as well get to know it.
Notes:
- You can see the parish boundaries on the parish map available at Brisbane Images (Identifier BCA_P007). ↩
- I thought I retrieved this map from Brisbane Images (part of the City Archives’ collection), but I did not record a catalogue number and can’t seem to find it there now. Bad record keeping, I know! ↩
- Notice also that the dotted line does not follow the same path as the creek today. Presumably, the creek was re-routed to provide more space for the park. ↩
- By the same token, we could also ask why Western Creek did not seem to influence the boundary of portions in Rainworth or Rosalie. ↩
More great work Angus
You should be submitting this website in order to satisfy the requirements of your doctoral thesis!
Regards
Peter
Seriously though, it’s wonderful to see you ‘gathering up the threads’ of these histories AND the clarity of your words and the great diagrams
Regards
Peter
I stumbled across this as I was doing some research for a homeowner who is interested in the history of the area. This is awesome research, and it is fascinating. Thank you.
I believe that the JCH initials you refer to are those of Johan Christian Heussler who owned a lot of this land in the 19th century.
QLD Government House, Fernberg, was originally built as his house.
Hi William. A relation of Johan, I presume?
I did wonder of the initials were of JC Heussler, but I assumed otherwise because the signature is dated 1926. And also I haven’t come across any reference to him working in the lands department. Do you know if he ever worked in the government?
I found your site whilst researching an architecture project of mine in the area. Its been so interesting (and helpful!) looking through all your awesome research. Thanks!
Great assistance when understanding the topography of Toowong west and it’s road layout. Much appreciated.
This website is simply amazing, well done on all your research especially the maps. I came across it while trying to research an old house at the top of Miskin St, Number 34, any idea where i can find out more about how it came to be? it looks like a grand old house
Awesome. very useful for some research on Portion 23 and the river end of Sylvan Road. Looks like a visit to the Lands Museum is a must!
One of the most anticipated joint names this year, the lightning barb air jordan 1 has been determined to be on sale on July 29, but so far, no store has announced the relevant lottery information, and there are even rumors that it has not a
Virgil Abloh, who is the number one symbol of the current trend, has also carried forward the symbol after taking up the position of Louis Vuitton! Although the large-scale use of Logo has long been the focus of discussions among fashion fans, in today’s era of excessive social media information, the injection of representative symbols can completely catch the eye, and this time the LV series Of course, I didn’t let it go. The characteristic LV Monogram is all over the details of various products, intertwined with indelible elements. In addition, the classic LV Damier pattern was converted into a “stamp” form and injected into this clothing series.